Why you should place regular analysis at the heart of your SEO
In this article I will review the importance of regular analysis to help SEOs learn what is and isn’t working on their website, helping to inform optimisation and testing programs.
Why is regular analysis required?
The world around us is forever changing which impacts online behaviour. The key reasons for this are:
1. Online search patterns change
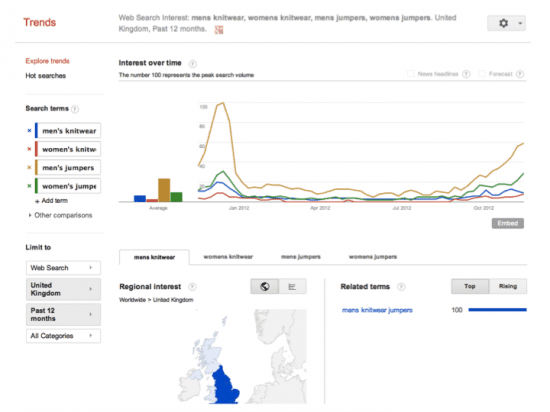
This is driven by several factors, including social trends and fads. A fad can drive a surge in specific search activity, only for this to wilt quickly.
A great example is retail fashion – each season has its theme and only a few of these themes will stand the test of time. Also some trends are cyclical/seasonal so will phase in and out of search e.g. Knitwear – popular at Christmas and through Winter.
Screenshot – declining and rising search keyphrases in the UK market
2. Search engines update algorithms.
The bête-noire of search. In 2012 a few companies have been hit hard by the two big impact Google updates, Panda and Penguin. Their traffic and rankings took a nose dive as their sites fell foul of a change in how Google assesses page quality and relevance.
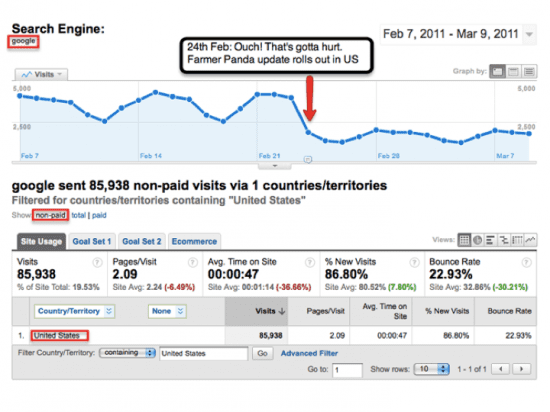
Source: http://www.wordtracker.com/academy/google-panda-farmer
Take a look at the SEOmoz algorithm change history to see how frequent changes are. Google has also started regular search quality highlights this year which show around 30-50 new filters and features monthly.
So, it’s essential you monitor SEO traffic KPIs regularly (at least weekly, if not daily). Ranking can be a useful benchmark but average rank can be misleading, as it will fluctuate naturally. For example, personalised search on Google means one person could see your webpage in position 1, and the next in position 10. An average rank of 5 gives you little meaning.
3. The visitor mix to your website changes
As your brand and marketing grow, the demographic mix of visitors inevitably changes. Via social media, you might have a boon in 18-25 year olds engaging with you. Via email marketing, you might attract a slightly older audience.
It’s important that you monitor your SEO data to learn how this impacts on search queries and the blend of brand/generic keyphrases driving your SEO KPIs.
This can be particularly helpful when planning landing pages. As the blend of keywords/phrases change, you can identify gaps in landing page coverage and use this knowledge to inform your content marketing plan.
4. Social & economic pressures affect buyer behviour
The recent economic woes are the most salient example. A reduction in disposable income (driven by rising costs) feeds through to changing shopping baskets – less ‘luxury’ items, lower average order values, more discounts/vouchers redeemed, higher basket abandonment etc.
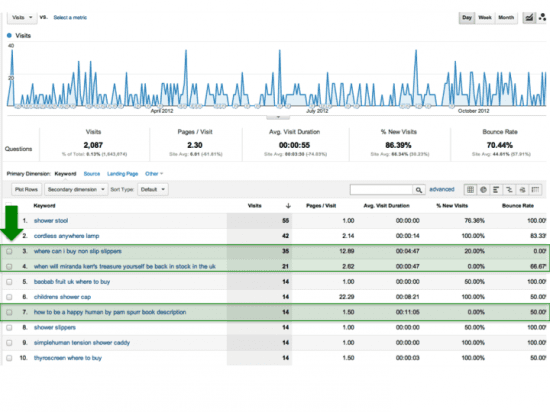
This can significantly impact search behaviour. A glance at the SEO reports might demonstrate a rise in the variety of question-led searches e.g. “what is the cheapest DVD recorder”.
Screenshot: example question led search queries showing in Google Analytics
5. Your business changes
For example, if you’re an e-commerce retailer, your product mix is likely to change over time. This means your marketing focus will need to evolve to match the product set, which has a significant impact on SEO (e.g. old webpages needing to removed from the index or 301 redirects to avoid dead-ends).
How do you know what impact these changes are having on your website performance? Through analysis. By analysis, I mean the three key strands:
- Web analytics data
- Voice-of-customer data
- Learning through testing
If you are following the good practice guidelines contained in this SEO series, then you should already be planning your SEO to mitigate this uncertainty e.g. regular keyword research, producing quality content, using social media to raise brand awareness and increase content sharing/voting.
What does this mean for SEO?
You will need to determine how internal and external influences affect your KPIs. This means having a consistent reporting format for these KPIs so you can quickly identify peaks/troughs. A sharp peak or trough is a prompt for more detailed analysis of the data to find out why.
Below are a few examples of what I mean to put this in context.
Quality of landing pages
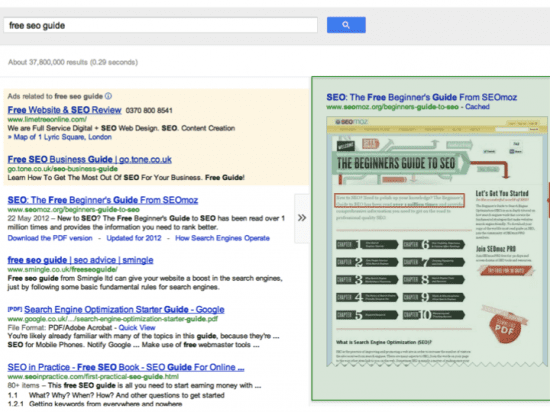
If your prices are suddenly uncompetitive and you experience lower CTR, this can affect rankings – you need to respond. Instant Preview means people can see your content before clicking and what they see influences their decision.
- ‘Home banker’ generic keyphrase searches
If search patterns change, you may no longer be visible for the latest search terms, affecting traffic.
If there is a reduction in offline and brand investment, you may see a decline in brand SEO traffic and revenue (also affecting assisted conversion). We saw this recently with a multi-channel brand that reduced the size & distribution of its bi-annual catalogue and saw a sharp drop in organic and paid brand search traffic.
There will be new keyphrase searches entering the market, or existing ones that become more popular, and you could miss out on these if you’re not on top of analysis.
- Low quality link neighbourhood threaten your ranking
The search engines focus on link quality (remember the Penguin update from Google) and Google & Bing have introduced disavow tools to help you manage the negative impact of poor quality/spammy links. You must use link analysis tools and Webmaster Tools regularly to stay on top of this.
Not convinced by the risk of link quality, then read this example.
What data should you be looking at and how often?
As a rule of thumb, here are the basics to monitor/measure and the suggested frequency:
| Data component |
Frequency |
Tool |
| Site crawl errors (focus on Google but also use Bing WMT) |
Daily |
Webmaster Tools (WMT) |
| Sitemap indexed pages |
Daily |
WMT |
| External linking domains |
Weekly |
SEOMoz/MajesticSEO |
| Total number of external links |
Weekly |
| Cumulative link profile (if using a tool like MajesticSEO) |
Weekly |
MajesticSEO |
| Keyword ranking (for high priority keywords/phrases) |
Weekly |
Advanced Web Ranking |
| Total number of keywords/phrases sending traffic via SEO |
Weekly |
Web analytics e.g. Google Analytics |
| Bounce rate (split by brand & generic) |
Weekly |
| Conversion rate (split by brand & generic) |
Weekly |
| Average order value (split by brand & generic) |
Weekly |
| Revenue (split by brand & generic) |
Weekly |
| Per Visit Value (split by brand & generic) |
Weekly |
Please note that the daily checks aren’t onerous – all you need is a quick glance into the WMT accounts first thing in the morning for peace of mind. Only if there is a problem do you need to delve deeper and spend more time analysing. Problems are the exception, not the norm.
This data is just the starting point: it’s intended to act as an early warning system for sudden changes (peaks and troughs). As soon as you identify a change, you need to then analyse what has caused this. Ask yourself the following questions:
- What has changed in our business (product mix, pricing, promotion etc) that could have caused this?
- What external factors (including competitor activity, bot traffic) might have influenced the data?
- What on-site factors might have influenced the data?
- What SEO factors could be causing this (e.g. external links, social sharing)?
- Are there any technical performance issue affecting the website?
What can you do in Google Analytics to make life easier?
As this series has focused on GA, I’m going to continue using this as the example.
Dashboards
I love GA dashboards (I know I should get out more!). They are the perfect tool for providing performance snapshots. Set-up an SEO dashboard that you can use to monitor top-level KPIs. Please see the example below that was set-up for a retail e-commerce Client of mine.
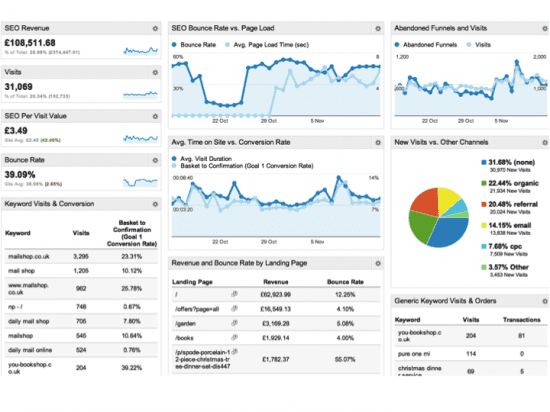
If you want to copy this dashboard then use the following link (easiest when already signed-in to your Google Analytics account):
https://www.google.com/analytics/web/permalink?uid=CGm33xMaSf2afDigeOvzmg
Custom Reports
These are useful for refining the data display to show exactly what you want without the need to filter standard reports or export data and manipulate via Excel.
Below is a useful starter report to help you understand how custom reports can be used. Note there are multiple tabs in the report to show different views of SEO data.
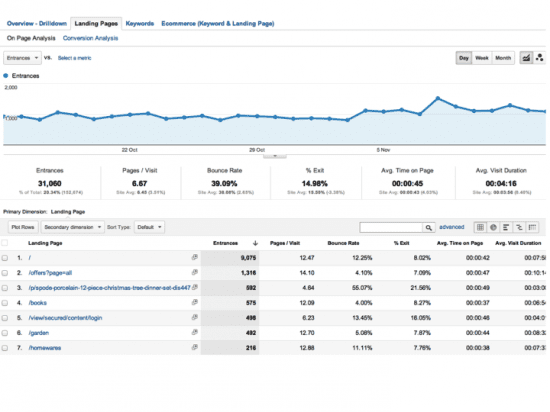
If you want to copy this Custom Report then use the following link (easiest when already signed-in to your Google Analytics account):
https://www.google.com/analytics/web/permalink?uid=OeQz1xGCRRu4XiJHLqJoIA
I recommend subscribing to @AvinashKaushik blog Occam’s Razor – he is a most generous man when it comes to sharing Custom Report ideas.
Advanced Segments
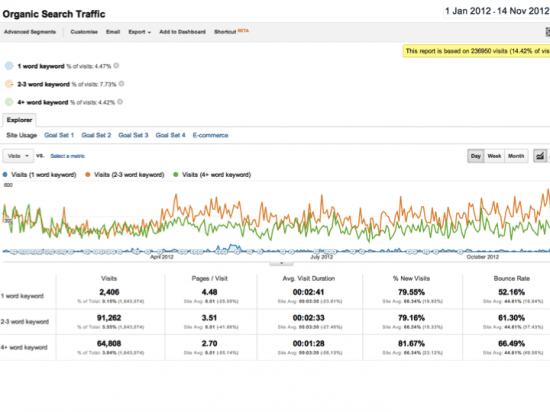
These are useful for drilling down in specific segments of standard reports. A good example is creating a segment for visits where there are more than X words in the keyphrase, useful for pinpointing long tail search activity. Over time you would expect to see this type of search query increase in volume, so an advanced segment can help you monitor the numbers.
I like to compare data for keyword queries with 1 word, 2-3 words, 4-5 words and 6 or more words. It helps me understand how well a site caters for searches across the tail, as well as identifying outliers (search terms I’d never have thought of yet are relevant to the content on the site).
Your comments
I hope this helps you understand why continued analysis is the lifeblood of SEO (and any other marketing channel).
The key take-away is this – if you want to improve the KPIs against which you are measuring SEO performance, you need to stay on top of the factors that are influencing the numbers. A one-off piece of analysis isn’t enough – the conclusions you draw may be irrelevant X months down the line. This is especially true in light of major search engine algorithm changes that can have pronounced effects on SEO traffic.
Your challenge is to define a process for regular analysis and create a toolset that enables you to deliver this efficiently (and minimising the time effort). I find that a structured approach makes life much easier and improves efficiency.
Please drop by and share your thoughts and if you feel the urge, share this with your friends/colleagues to encourage further debate.
Did you miss the other posts in this SEO series? You can catch up here:
If you have followed the 12 steps in this SEO series, you have either cured your insomnia or found the path to enlightenment. Either way – I hope they’ve helped you review or improve your approach.
- Using Web analytics to benchmark performance and drive insight through data
- Competitor analysis for SEO
- Using the Google Toolkit to identify good performing keywords and execute keyword research
- Targeting the full tail of search
- Testing page titles & meta descriptions to boost SEO
- Weeding out poor performing keywords with the help of Google Analytics
- The role of landing page optimisation and testing in SEO
- Using Google Analytics for link building
- How to identify quality domains for SEO
- The increasing importance of social media within SEO
- Using content marketing to support SEO.
- Using Voice-of-Customer data to drive SEO insight.
Thanks
james


