If you use Google Analytics, and your site gets any traffic from search engines, you will love the latest feature they've just added, which was announced on the Webmaster Tools Blog on 4th October.
Here are the stats you used to get when looking at a 'Search Engine Keywords' report:
- keyword
- number of visits
- pages per visit
- average time on site
- % new visits
- bounce rate
So, you could see that you had (say) 50,000 visits for the word 'laptops', but you were left asking questions like "so what?", "is that good, or bad?", and left looking at other tools to try and answer those questions.
So What's New?
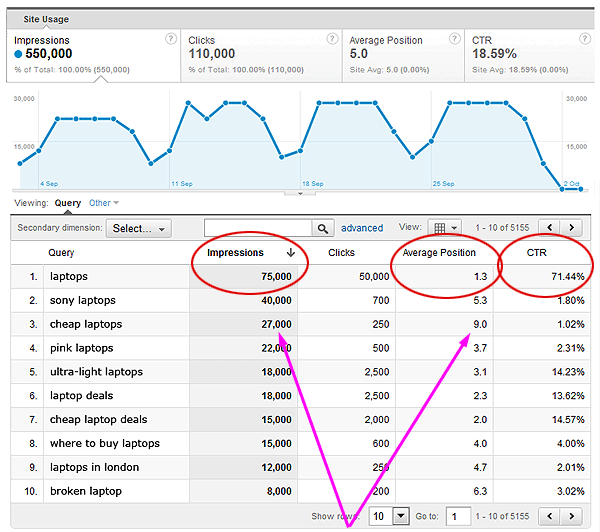
Now, here is one of the new 'Search Engine Optimisation: Queries' reports:

I've highlighted the exciting bits there:
- The red circles are new pieces of data they've added (from 'Webmaster Tools')
- The pink arrows point to a single example of an instantly actionable piece of information
As you can see, rather than asking "so what?", we can now say "oh, I'm already in position 1 for laptops - no more work needed there... but LOOK - I'm way down in position *nine* for 'cheap laptops', and I'm only getting 250 of a potential 27,000 visits! Let's put some work into improving that."
It's a struggle to think of a business that wouldn't benefit from having instant access to this kind of information.
How to Get at the Information:
To use this, firstly, you must have both 'Google Webmaster Tools' access AND 'Google Analytics Admin' access for the site you'd like to look at.
(if you find yourself struggling with either of those, feel free to pester me on Twitter & I will happily point you in the right direction).
Following that:
- Log into Google analytics.
- If you see the phrase 'New Version' toward the top-right of the screen, click on that.
- Once in the 'new version', select the site you want to look at.
- Now, you should already be in the 'My Site' tab (toward the top-left of the screen). If not, click into it.
- Choose 'Traffic Sources' from the left-hand navigation.
- Within that, click on 'Search Engine Optimisation' & then 'Queries'.
- You will see a report similar to the screenshot above.
- Weep with joy at the new, simple information that helps you with your job. (ok, maybe that's just me)
Other Extras:
Aside from the 'SEO Queries' report, there are a couple of other useful reports available alongside this:
- You'll see there is a similar 'Landing Pages' report. Rather than telling you which keywords you can improve on, this shows you which landing pages have potential for improvement.
- And you'll see there's a 'Geographical Summary' report. This shows you, by country, how many Google Search impressions you get, how many clicks, and what your CTR is. Great for multinational sites.
As with every stat in Google Analytics (perhaps moreso in this case), these numbers will not be flawlessly accurate, but they hand you the basic information - all in one place - to be able to go and improve your site today, tomorrow, and next week. In my opinion these are among the best changes we've seen this year - very small tweaks that make the tool far more useful for almost all websites.
Do drop a note in the comments if you have any further thoughts on this, and do share this post if you feel others would benefit.


