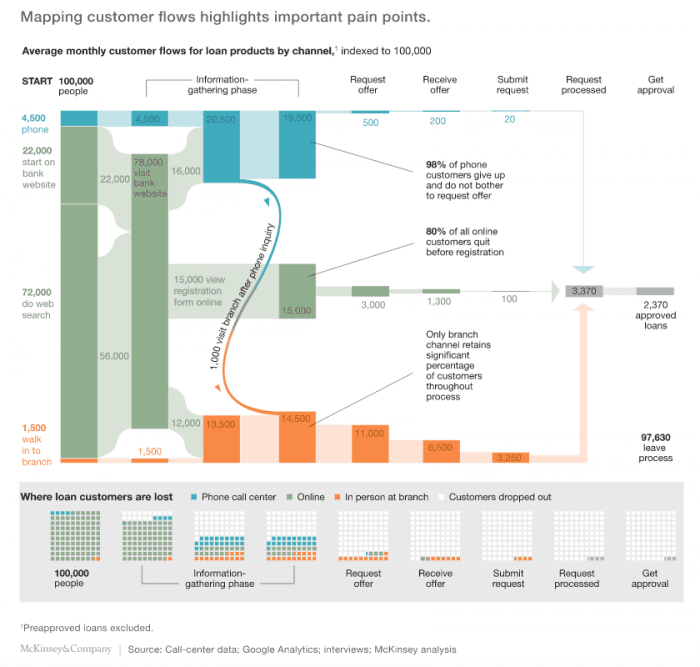
Chart of the Day: A conversion funnel example from the loans sector
A different format of chart for today, showing analysis and modelling for digital marketing rather than statistics on adoption or benchmarks.
The recommended Smart Insights approach for creating achievable marketing plans is centred on creating realistic forecasts of leads, sales and revenue in the year ahead based on conversion-funnel model spreadsheets with the contribution of different channels shown in this digital marketing planning spreadsheet.
This example shows how in some types of business, like the financial services sector, it's important to take into account multichannel behaviour as the decision will be influenced by different channels such as web-phone-branch and the customer journey will involve switching between them.

This is a useful visualisation that adds more detail to a ROPO analysis by breaking out different channels in each vertical bar and then colour coding each channel from blue - phone, green - web and orange - branch enquiries. Online channels, particularly search, are most important at the start of the journey, but with the web handing-off to branch and phone at the information gathering stage.


