The latest statistics on mobile app usage to inform your mobile marketing strategy
With smartphone users currently accounting for around a quarter of the four billion mobile users around the world it is already a priority to optimise content and experiences for mobile consumption. Mobile apps offer a fast and convenient way for people to access information and as such it is more important than ever to understand how they are used and to keep up with the habits of their users.
In this post we have compiled the latest stats from the best sources on mobile app downloads and usage to give a summary of statistics on consumer mobile app adoption to help members develop their mobile strategies.
How important is app usage compared to mobile browsing?
Apps have surpassed web browsers in terms of time spent on mobile devices.
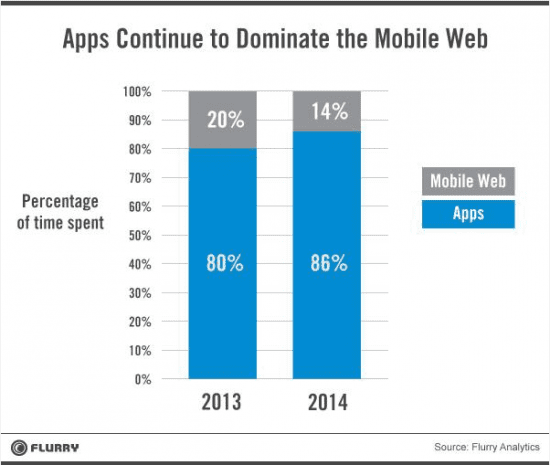
A recent study conducted by Flurry Analytics showed that apps currently command 86% of the time that the average US mobile consumer spends on their smartphone. Smartphone users spend an average 2 hours and 42 minutes on mobile devices with app usage accounting for 2 hours and 19 minutes of this time. The stats show that apps are dominating users' time spent on devices, with mobile web browsing lagging in comparison.
Source: Flurry: Apps Solidify Leadership Six Years into the Mobile Revolution
How much time do users spend with mobile apps?
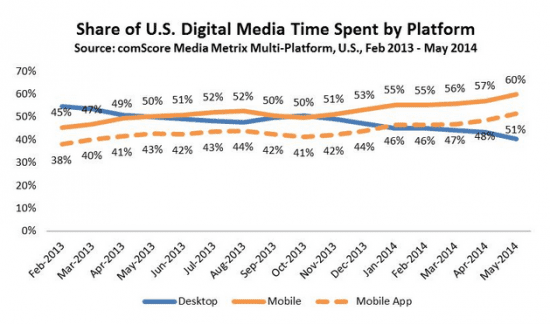
Time spent using apps accounted for 51% of all digital media time spent in May.
comScore reports that mobile devices account for 60% of all digital media time spent in May, with apps representing 51%. The stats show that mobile dominates across categories
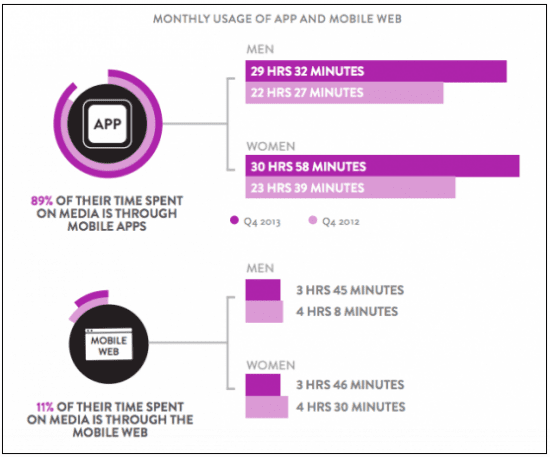
Nielson found that smartphone users spend 89% in apps and just 11% using mobile web.
Source: comScore: Major Mobile Milestones in May: Apps Now Drive Half of All Time Spent on Digital
comScore’s chart shows that time spent on desktops has decreased in 2014 while digital media time spent on mobile has increased in line with time spent on mobile apps.
Source: comScore: Major Mobile Milestones in May: Apps Now Drive Half of All Time Spent on Digital
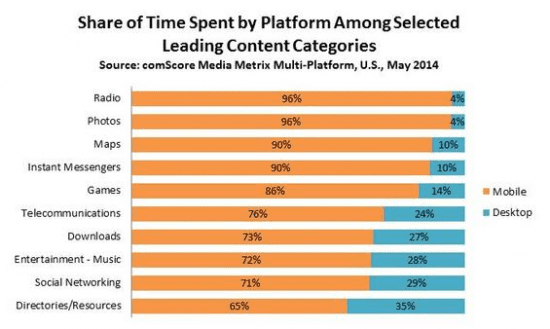
Mobile clearly dominates in ‘on-the-go’ categories such as radio, photos, maps and instant messengers. The prevalence of game playing on mobile is equally high while despite Facebook being the most popular mobile app as of April 2014 nearly 30% of users still opt to check their social media sites on a desktop computer.
Source: Smart Insights: New Consumer Media Consumption Research
89% of time is spent accessing media via mobile apps while just 11% of time is spent on mobile web. Women lead in time spent on apps, averaging on 30 hours and 58 minutes in Q4 2013 in comparison to 29 hours and 32 minutes spent by men.
Which apps are the most popular?
Facebook continues its run as most popular mobile application.
Unsurprisingly, Facebook continues its run as most popular mobile app, followed by entertainment apps including YouTube and Pandora Radio. Utility apps prove popular with Google Maps, App Maps and The Weather Channel mobile app all placing in the top 15 smartphones apps as of April 2014. Communications apps have seen a rise in popularity although it’s interesting to note that WhatsApp is not listed among the most popular smartphone apps.
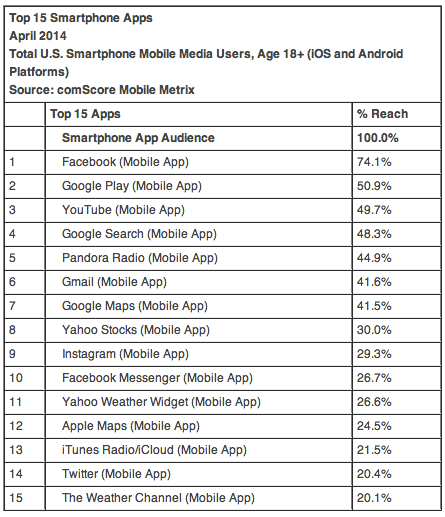
Source: comScore: comScore Reports April 2014 U.S. Smartphone Subscriber Market Share
How many times are apps used? What is retention rate for mobile apps?
App retention rate has improved 6% since 2010
A Localytics study published in June 2014 showed app retention has improved 6% over the past four years, with apps used just once declining to 20%.
39% of apps are now used 11 times or more, an improvement of 13% over the same period.
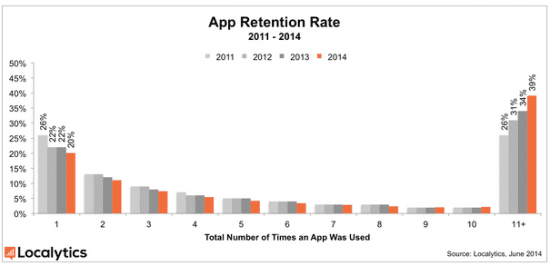
Source: Localytics: App Retention Improves - Apps Used Only Once Declines to 20%
In 2013, apps opened 11 times or more on both Android and iOS stood at 34%.
In 2014, Android has overtaken iOS with the percentage of apps used 11 times or more rising to 45% compared to iOS, which remained at 34%. 23% of iOS apps are only opened once, whereas this applies to just 16% of Android apps.
Weather and social networking apps have the smallest chance of being opened just once.
Where are apps downloaded?
Consumers are downloading mobile apps from Apple App Store, Google Play and Amazon App Store. From March to April 2014 the whole market grew around 1.5%, with both Google Play and Apple App Store showing positive growth. Current market share for Google Play is 39% with Apple App Store increasing to 61%.
Searching app stores is the most popular method to discover apps, followed by receiving a recommendation from family and friends, a mention on the mobile device or network carrier page, an email promotion and an offline mention in TV and print.
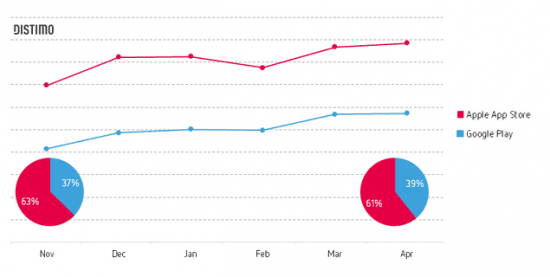
Source: Distimo: Top Global Apps April 2014
What are the implications of mobile app usage for brands?
With the increasing importance of mobile usage overall and the popularity of mobile apps, it's clear that businesses need a strategy to assess whether a mobile optimised site and/or mobile app will give the best returns.
However answering the app vs mobile site is not clear.The statistics imply that brands need to ensure their websites are optimised for mobile and work well across a multitude of mobile platforms. This is the minimum amount of attention paid to mobile that is desirable and in the long-term, brands need to pay close attention to the behaviour of their target audience to map out the ecosystem of the apps they use on a daily basis. We have seen that a fair number of users, use apps only an handful of times, so benchmark against similar apps to assess their level of usage.
Once this data has been weighed-up a mobile marketing strategy can be planned. Just as with the rest of the digital ecosphere it’s likely that this will include a mixed of owned apps, earned and paid tactics. Please see our updated Mobile Marketing Guide to help you develop your strategy.

Mobile apps are a major theme of Digital Impact 2014, which is due to take place in London on September 17, 2014. To find out more visit: http://www.smartinsights.com/digital-impact-2014


