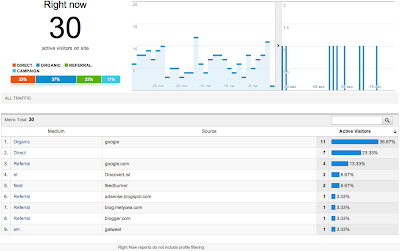
Over the last few months we’ve seen the new Google Analytics platform (v5) build momentum with a string of new feature releases, and last week it was the turn of real-time reporting to be included as the latest addition to the family.
In my previous role with an analytics vendor, I would often have clients come to me with “Real-time data” on their list of requirements but in reality very few were in a position to be able make actionable decisions based on the data that quickly; to a greater extent that is still the case today. As analysts we struggle already to make the best use of the vast quantities of data we already have. Would increasing that with real-time reports across the system only exasperate that?
In certain situations real-time data can be a very powerful tool in the analyst’s kitbag. I’ve been testing the real-time reports for a few weeks now and whilst there is still room for improvement, I’ve been able to help a client find out some great insights on events that have been occurring which otherwise would have been a lot harder to discover.
If you haven't seen Real Time, this is what you get:

[Editors note: When Google announced the Real Time feature at the end of September it wasn't available to all, but prompted by Helen's great ideas I've checked it out and I think it's rolled out now - you access it in the new version of Google Analytics via the home tab. It's a separate series of 4 reports showing active visitors on the site currently, pages they are accessing and their campaign sources and select keywords. Note that this doesn't mean that all reports are real-time as with other tools, rather it's a limited set of reports to which advanced segments can't be applied]
Here’s 5 practical examples of how you can use the new reports which I think help to demonstrate when real-time analysis can be beneficial. One of the key uses for me is being able to give marketers greater visibility on how events external to your site such as Social, TV and advertising campaigns influence your website audience, in order to optimise performance and prove ROI.
1. Measuring the impact of social media
You’ve just sent a tweet out or blogged a new post and want to see how many people are interested and picking up on your content. Use the content report to see live stats of how many people are coming to your article and the referral report to see how many people have come from these sources.

Real-Time Traffic Sources report showing referrals in Google Analytics:
2. Understanding the response to TV advertising
It’s 6pm and your new advertising campaign is due to be broadcast on TV. You want to see what the impact is to your brand during and after the commercial. Use the overview report to see how overall traffic to your site is increasing and view the activity timelines by the second and minute as your advert plays to monitor change.

Real-Time overview report showing activity timeline
Drilldown into the Traffic Sources report to view increases in traffic from direct channel and brand search terms and use the locations report to view which geographic regions people are visiting from.
3. Assessing the interest in breaking stories
You’re a publisher with dynamic content and news stories which change frequently throughout the day. Use the content report to see which stories are generating the most interest and use this information to help optimise the content you promote elsewhere on the site.

Real-Time Content report showing page level activity
4. Measuring the performance of product campaigns
You’ve launched a new product and are running a paid search campaign to promote this. Use the Traffic Sources report to see how many people are responding to your marketing. Drill down into the traffic cpc medium to see which keywords people are responding to help optimise your campaigns. Secondly when any new campaigns go live get peace of mind that these are being tagged up correctly by using the reports to verify data is being captured by Google Analytics.
5. Verifying tag code is working correctly on new pages
You’ve just put new pages live on your site and want to be certain that the tag code is working and Google Analytics is capturing data. Now there is no need to have to wait, simply view the content report and search for your page and watch as you test the page out on the live site.
And if that’s not enough to convince you there’s always the novelty fun factor. Aside from the fascination of sitting watching visitors as they arrive on your site, big brother style, Google Earth has been integrated into the location report so you can zoom around travelling the world with your visitors. Now that’s just plain cool!
I’d love to hear your ideas on how you think these new real-time reports can help your business or how you're using them already.

Thanks to
Helen Birch for sharing her advice in this post. Helen works for
Foviance as an analytics consultant. She has worked in the industry for 5 years. Helen helps clients to design and implement bespoke analytics solutions and has worked consulting with organisations such as Bourne Leisure, Cancer Research, More Th>n, Reed Exhibitions, RBS and UKTV. Helen is a Google Analytics Certified professional and manages the Foviance relationship with Google.


 Thanks to Helen Birch for sharing her advice in this post. Helen works for

