How to measure the marketing effectiveness of video content
Your video is clocking up hundreds of views, which is great. But does that mean it’s successful?
Not necessarily.
A revved up view counter in YouTube may indicate that your video is popular, but it doesn’t tell the full story.
For example, it doesn’t tell you how many people only watched the first couple of seconds before dipping out, if they re-watched any sections or if they skipped entire parts.
Rather than watching views, you need to be measuring a much broader set of metrics.
If, like most people, you choose to host your video via YouTube, the metrics you need to consider lie deep within the analytics section of YouTube.
YouTube Analytics options
YouTube Analytics offers in-depth video data which is much more than just views.
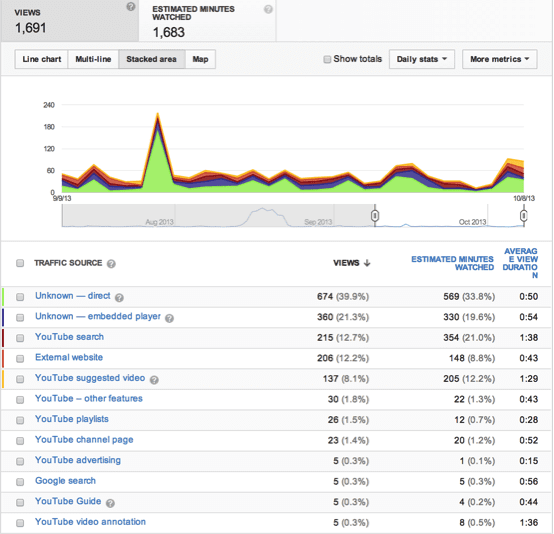
One of the first places to start is the Traffic Source. Find out where your viewers have come from and how long they spend watching your video. You can pinpoint the exact spot in your video where viewers might drop off or replay several times.
It could be that there is a particularly important or funny point in your video at this moment, or it could be that your content is not clear, and your viewer needs to review it again to make sense of it. This is important for measuring retention statistics and forming a strategy to improve viewer engagement.
Once you have identified where viewers who are spending the most time on your videos are coming from, you can alter your marketing strategy to attract more visitors. For example, are they being directed from an external site or a Google search?

There are four ways to view your video data: Line Chart, Multi-Line, Stacked Area and Map.
Line Chart
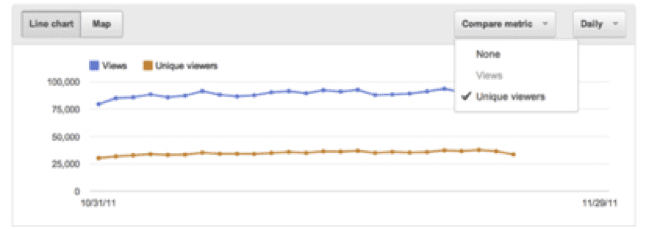
Each video’s information can be further broken down into a date granularity line chart. This shows how video views may have increased or decreased over time.
You can also choose to compare these metrics with a second metric, for example ‘unique cookies’ and ‘viewers’.

Image courtesy of https://support.google.com/youtube/answer/1714323?hl=en
Multi-Line Chart

Image courtesy of https://support.google.com/youtube/answer/1714323?hl=en
Get a clear insight into up to twenty-five videos, channels or geographies over a specified time period. The chart default setting is to show the top five results, represented by different coloured lines. However, you can customise this.
Stacked Area

Image courtesy of https://support.google.com/youtube/answer/1714323?hl=en
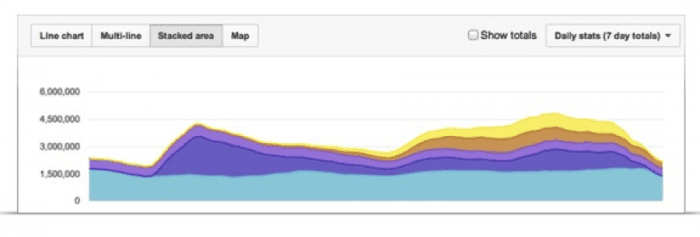
Just like multi-line, the Stacked Area view allows you to quickly identify trends in up to twenty-five videos, channels or geographies.
Interactive Map

Image courtesy of https://support.google.com/youtube/answer/1714323?hl=en
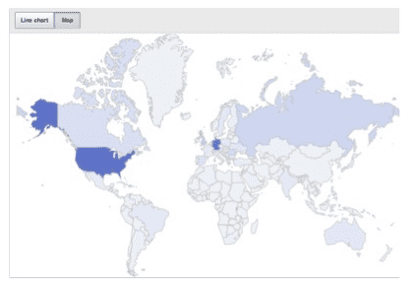
The interactive map is useful if you’re looking to target a specific country. The darker an area is, the more views it is getting in that country. To get a more detailed result, hover your cursor over the country.
You can also measure your click through rate and close rate whilst checking the effectiveness of your YouTube annotations.

Image courtesy of https://www.youtube.com/yt/playbook/en-GB/yt-analytics.html
Once you have this data, you can tweak your annotations to maximise viewer engagement and increase your click through rate.
In my next post I will explore the measurement tools and techniques available in other video networks and platforms including Vimeo, Wistia and an example of campaign comparision between Samsung and Nokia.


