The best digital marketing research across marketing channels - including SEO, PPC, CRO, social, mobile, martech, email, e-commerce, and UX - to help inform your 2019 marketing strategy
Because the state of digital marketing is always evolving, it is important to keep up-to-date with the latest research in your industry or marketing channel in order to stay ahead of your competition. However, it can be difficult to find the digital marketing research you need to help inform your digital strategy.
We first curated these stats in 2017, but during 2018 and 2019, we've been committed to updating this article using the best digital marketing research data sources, which the team at Smart Insights have found helpful and informative throughout the year. Hopefully, this will help you too!

SEO statistics 2019
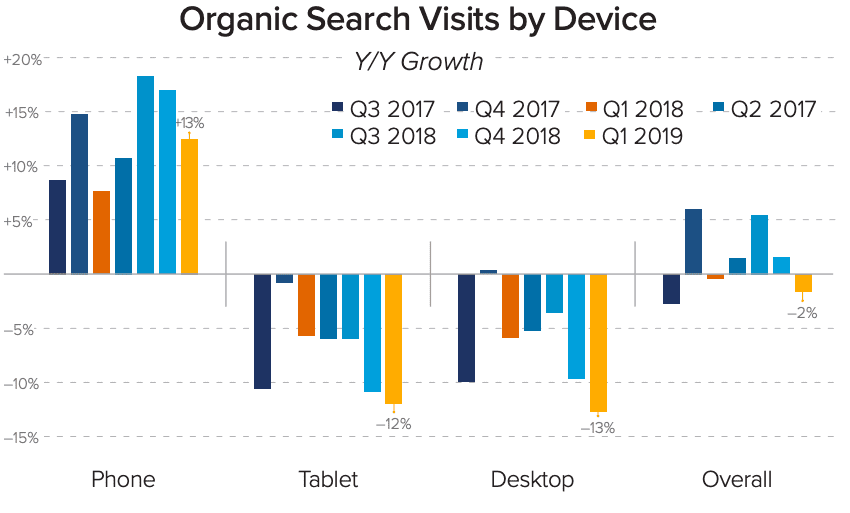
- Total site visits produced by organic search declined by about 2% in Q1 2019, down from 2% growth in Q4 2018 (Merkle, Digital Marketing Report Q1 2019).
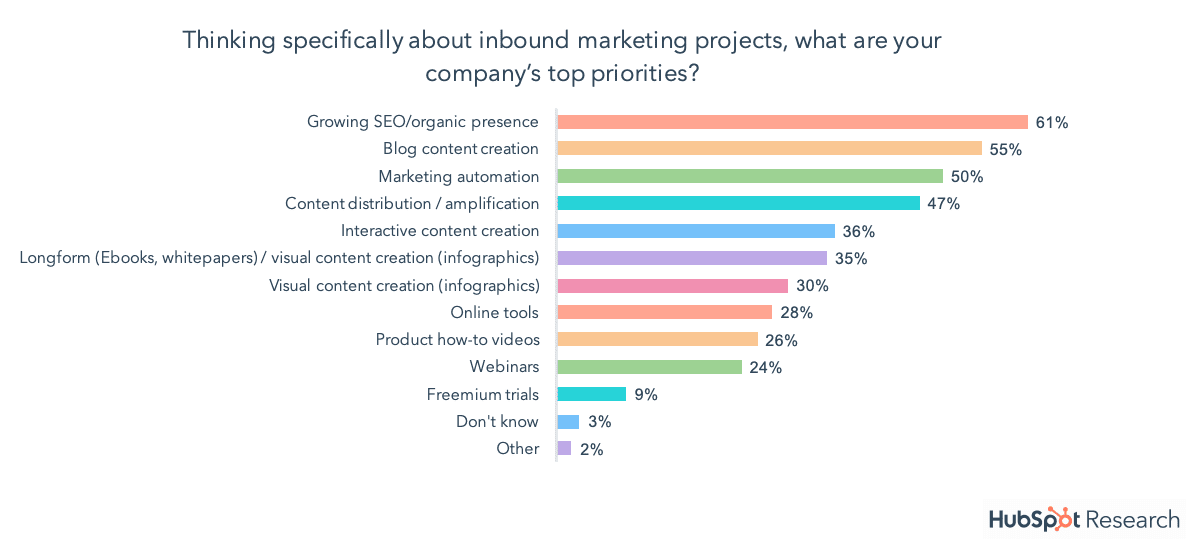
- 61% of marketers say growing SEO/organic presence is a high inbound marketing priority (HubSpot, State of Inbound, 2018).
- Ranking first on SERPs is more important than ever. On desktop rank 1 achieves an average CTR of 19.3% compared to rank 10 with 2.2% CTR. Similarly on mobile, rank 1 achieves 27.7% CTR and 2.8% for rank 10 (seoClarity, CTR study, 2019).
- 46% of marketers say the August 1st 2018 update didn't affect them at all and even more surprisingly 25% of marketers didn't know what it was (Moz, The State of Local SEO Report, 2019).
- Total organic search visits produced by Google fell 2% Y/Y in Q1 2019, down from 3% growth a quarter earlier. On mobile devices, Google organic visits grew 6% Y/Y in Q1 2019, down from 12% in Q4 2018. (Merkle, Digital Marketing Report Q1 2019).
- Businesses that show up on the first page of results get 92% of consumer traffic (Joal House, 2019).
- Phones accounted for over 50% of all organic search visits in Q1 2019, the first time passing that milestone (Merkle, Digital Marketing Report Q1 2019).
- Google has a 92.42% search engine market share as of April 2019 (StatCounter, 2019).
- In the past year, organic search visit share is down about a point, with paid search and social media seeing the most significant visit share gains among major channels (Merkle, Digital Marketing Report Q1 2019).
- Location intent queries brought websites ranked on 1st position the highest increase in CTR (4% on desktop and 6.32% on mobile) (Advanced Web Ranking, 2019).
Download Premium Resource – Successful SEO Guide
Our comprehensive guide to Search Engine Optimisation best practices isn't just for SEOs, the clear explanations mean that it can be used by marketers to ask the right questions to boost their SEO.
Access the Successful SEO guide
PPC and CTR statistics 2019
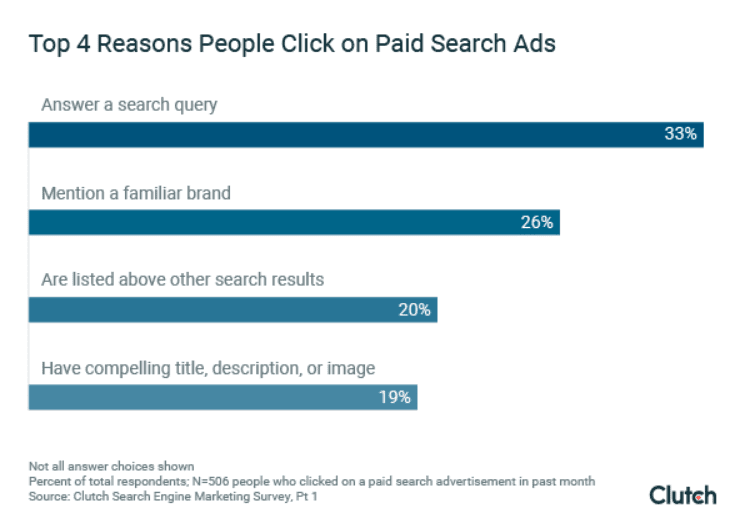
- One-third of respondents (33%) click on a paid search ad because it directly answers their search query (Clutch, Search Engine Marketing: Why People Click on Paid Search Ads, 2019).
- Just 8% of advertisers are decreasing their advertising investments on Search this year; this compared to a whopping 46% that are increasing them (WordStream, 2019).
- Businesses make an average of $2 in revenue for every $1 they spend on AdWords (Google Economic Impact Report).
- Google display campaigns reach 80% of global internet users (Google Benchmarks and Insights).
- Google text ad spending declines increased to 12% Y/Y in Q1 2019, while Google Shopping spending growth remained robust at 41% Y/Y (Merkle, Digital Marketing Report Q1 2019).
- Click growth for search ads accelerated to 10% Y/Y, but CPC growth slowed from 7% in Q4 2018 to 4% in Q1 2019, primarily due to the mix shift to mobile where CPCs remain lower than average (Merkle, Digital Marketing Report Q1 2019).
- Nearly two-thirds of people (63%) are most likely to click on a Google search advertisement. The number of people who are most likely to click on search ads on other sites – Amazon (15%), Youtube (9%), and Bing (6%) – is less than half of the number who are most likely to click on Google search ads (Clutch, Search Engine Marketing: Why People Click on Paid Search Ads, 2019).
- 70 percent of millennials like it when they can click on a product from an ad. (Google, 2018).
- People who visit a website after clicking on a PPC ad are 50 percent more likely to make a purchase compared to visitors who clicked on an organic search result (Wordlead, 2019).
- 2.3 billion "bad ads" were taken down by Google in 2018 (DMR, 2018).
- On average, most businesses see a 200% return on their investment when purchasing Google Ads (Power Traffick, 2019).
- US and UK adblocker usage is down 2%, whilst the use is up 2% for in Norway and Finland (Smart Insights, Q4 2018 online marketing statistics compilation).
Download FREE Resource – 10 costly AdWords mistakes
The top 10 paid search mistakes and what to do instead. Covering the most up to date and most common mistakes the guide is a great reference point to help you succeed with paid search marketing.
Access the
Digital strategy, transformation, and technologies statistics 2019
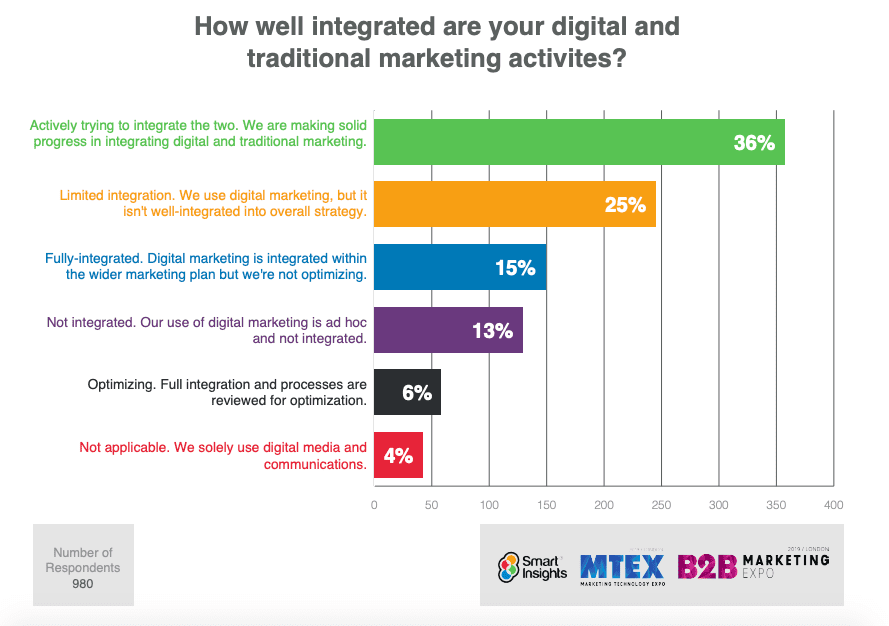
- Over a third (36%) of marketers are actively trying to integrate digital and traditional marketing activities, with a quarter saying they have limited integration and 13% saying their approach is ad hoc and not integrated. Just 15% say they are fully integrated with a further 6% optimizing their approach (Smart Insights, Managing Digital Marketing 2019, 2019).
- Over 45% of sales and marketing professionals who indicated they currently have an account-based marketing program in place report they’ve practiced ABM for less than one year. And nearly 2 in 5 respondents classify their organization’s ABM program as still being in its early stages — just beginning to implement tools or processes to support the larger program (Terminus, State of Account-Based Marketing, 2019).
- Over 50% of marketers intend to add additional technology in 2019 to their ABM stack. This number has decreased dramatically since 2017, where 83% of respondents planned to add new technology (Terminus, State of Account-Based Marketing, 2019).
- Website development, email marketing and social media are the most effective channels for B2B (Smart Insights, 2019).
- The modern living room features a multitude of connected devices, including significant innovation and adoption of OTT and IoT landscape (comScore, State of Digital, 2017).
- Marketers who usually or always plan their projects and campaigns when executing against their strategy are 356% more likely to report success (CoSchedule, State of Marketing).
- CRM, marketing automation and website visitor intelligence are the three most commonly used martech tools for companies that are advanced in ABM strategies (Terminus, State of Account-Based Marketing, 2019).
- 10% have a digital transformation in place for longer than two years and almost a quarter (24%) have just started. Roughly 3 in 10 (31%) are preparing to start their digital transformation program within the next year (Smart Insights, Managing Digital Marketing, 2019).
- Shockingly, nearly half (45%) of businesses don’t have a digital marketing strategy, but they are doing digital marketing. This seems to go along with a more general lack of planning since 40% do not have a marketing strategy in which digital marketing activities should be aligned against (Smart Insights, Managing Digital Marketing 2019, 2019).
- AB testing is popular, with almost half (49%) of companies using it to research and improve customer journey effectiveness (Smart Insights, Managing Digital Marketing 2019, 2019).
Download FREE Resource – Digital marketing plan template
Our popular marketing planning template built on the Smart Insights RACE planning system.
Access the Free digital marketing plan template
E-commerce statistics 2019
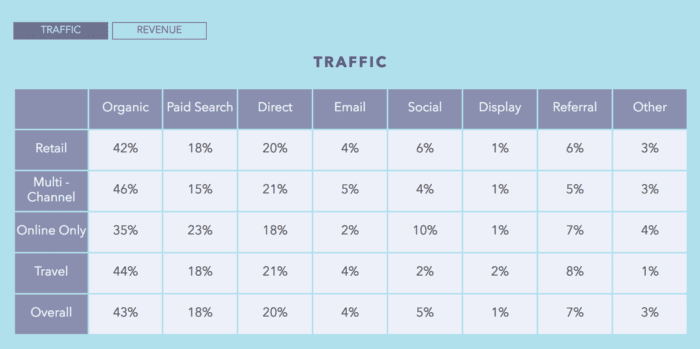
- Organic traffic and paid search are the most frequent sources of e-commerce traffic while channels such as display were less frequently used (Wolfgang Digital, E-commerce KPI Report, 2019).
- Average e-commerce conversion rates are 1% – 2%. Even if you are doing everything right, you can still only expect to win the sale around 1.5% of the time (IRP, E-commerce Benchmarks, 2019).
- Cost-per-acquisition has increased by 4.92% in the last year (September 2018 versus September 2019) now standing at 11.68% (IRP, E-commerce Benchmarks, 2019).
- The overall cart abandonment rate for H1 2019 was 84.29% (SalecycleRetail, Ecommerce Remarketing Report, 2019).
- The average open rate for abandon cart emails is 15.21% with the click-through rate standing at 21.12% (SmartrMail, Ecommerce Email Marketing Statistics By Industry, 2019).
- 43% of consumers say that they research products via social media before making a purchase, showing the importance of a social media presence for retailers (Global Web Index, Social Flagship Report, 2019).
- 47.5% of US online fashion shoppers' last fashion purchase was inspired by social media (YotPo, US Fashion e-commerce Report, 2019).
- Consumers are growing increasingly wary of creating online accounts with 56% of US consumers failing to do so when shopping online. Of these, 32% don't want marketing emails, 24% are worried about providing personal data, 22% say it takes too long and 13% claim they aren't planning on buying from the same store again (DMI, What Buyers Want survey, 2019).
- 25% of US adult consumers are likely to make a purchase via AR/VR technology within the next year (GfK, FutureBuy Report, 2019).
- Personalization is becoming increasingly important, especially among consumers. In fact, 72% of consumers will now only engage with personalized messages (SmarterHQ, Privacy and Personalization Report, 2019).
- 80% of customers say that technologies used in retail and retail innovations have led to an improved shopping experience (National Retail Federation, Consumer View Summer, 2019).
- Product reviews can make a big impact on purchase behaviour with 30% of shoppers believing that product reviews from people like them display understanding from retailers (Salsify, Consumer Research Report, 2019).
Download FREE Resource – 10 e-commerce mistakes
Explore the top 10 e-commerce mistakes and how to avoid them. Ecommerce is a fast-moving environment and we actively keep our mistakes up to date so you’re always making the most of your marketing
Access the
Content Marketing statistics 2019
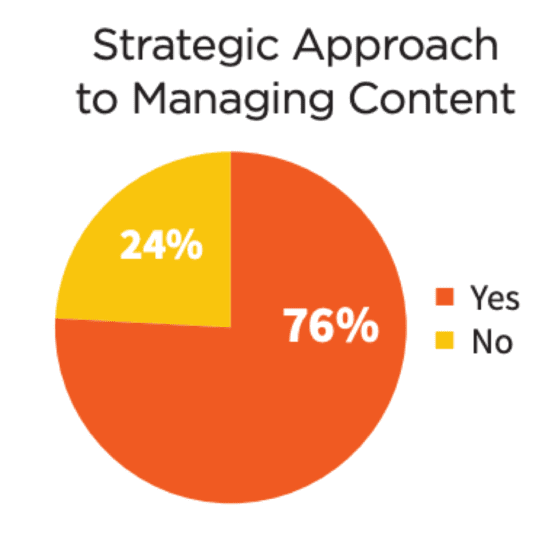
- Although 76% of marketers say their organizations take a strategic approach to content marketing, only 59% have a document content marketing strategy (Content Marketing Institute, Content Management and Strategy Survey, 2019).
- 86% of B2B marketers have used content marketing in the year to raise brand awareness (Content Marketing Institute, 2020 B2B Benchmarks, Budgets and Trends, 2019).
- Content continues to be a vital tool with 45% of marketers saying that at least 50% of their campaigns are content-led (World Media Group, The Future of Global Content-Led Marketing, 2019).
- The benefits of content marketing are now outweighing the cost of content creation and analysis, with 98% of B2B marketers now accepting that content performance justifies its cost (Walker Sands, The Future of B2B Content, 2019).
- 25% of CMOs believe that content creation and management are vital capabilities when it comes to supporting a marketing strategy (Gartner, The Annual CMO Spend Survey, 2019).
- Only 41% of B2B marketers have a documented content marketing strategy, which has increased just 3% compared to last year (Content Marketing Institute, 2020 B2B Benchmarks, Budgets and Trends, 2019).
- As well as brand awareness, content marketing can help to strengthen relationships with existing customers. In fact, 63% of B2C marketers have successfully used content marketing to build loyalty with existing customers in the past year (Content Marketing Institute, B2C Content Marketing Benchmarks, Budgets and Trends, 2019).
- Only 16% of marketers say they have the right technology in place to manage content across their organization (Content Marketing Institute, Content Management and Strategy Survey, 2019).
- A huge 89% of marketers now believe that their content marketing strategy is linked to all other parts of their business, compared to just 45% in 2018 (Zazzle Media, The State of Content Marketing, 2019).
- Over half (51%) of marketers agree that using more data to create customized content that serves the customer journey is a top priority for the next 12 months (Altimeter, The State of Digital Marketing, 2019).
Download FREE Resource – Top 10 common content marketing mistakes
Grow your audience and build interest and leads by avoiding these common mistakes. With so much content being produced, it's important your content marketing strategy cuts through. Our content marketing mistakes guide reveals the most common mistakes, but more importantly what to do about them, with strategy recommendations, examples and relevant resources identified
Access the
Social media statistics 2019
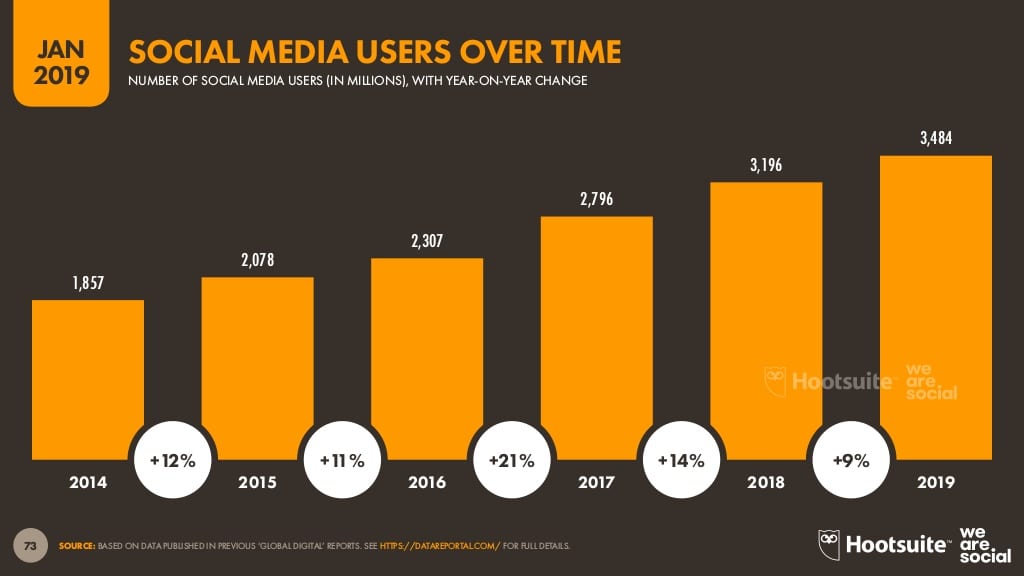
- 3.484 billion people are now on social media, which equates to around 45% of the world's population (Hootsuite, The Global State of Digital, 2019).
- People are starting to delete their social media profiles or remove social media apps from their phones as part of a 'digital detox'. Of those who have, 29% did so because they felt overloaded by social media (Exposure Ninja, 2019).
- Pinterest is becoming the social media platform for e-commerce companies, with 75% of Pinterest users saying they are "very interested" in new products, compared to 55% of people on other platforms (Pinterest, 2019).
- 28% of consumers have used social media to contact a company in the last year, with 30% saying it is convenient and 23% believing it to be a good way to get 24-hour service (Drift and Survey Monkey, State of Conversational Marketing report, 2019).
- Stories are the next big thing on social media and 64% of businesses have either already added Stories to their social media marketing strategy or they are planning to do so within the next 12 months (Hootsuite, Social Trends Survey, 2019).
- 45% of Instagram ad spend is currently being spent on Stories on the platform (Marin, Digital Advertising Benchmark Report Q2, 2019).
- 57% of brands have found social media Stories to be an effective part of their marketing strategy (Buffer, State of Social Report, 2019).
- All age groups primarily use social media to share pictures and updates, with 57% of Baby Boomers, 50% of Gen Xers, 44% of Millennials and 33% of Gen Zers agreeing with this (Adobe, Voices of the Generations report, 2019).
- 25% of website referrals from Twitter are returning customers (Parse.ly, 2019).
- Older adults are more likely to click on Facebook ads, with those aged 65 and over having an average click-through rate of 3.42% on the platform compared to 18 to 24-year-olds' Facebook ad CTR of 1.05% (Pixability, State of Digital Advertising report, 2019).
- When it comes to satisfaction with social media platforms, Pinterest is leading the way with a satisfaction score of 80, which is stable compared to 2018's figures. Facebook has the lowest satisfaction score at just 63 (American Customer Satisfaction Index, 2019).
- 50% of marketers say that personalizing content and experiences is a key challenge for social media going forward (Hootsuite, 2019).
Download FREE Resource – 10 common social media marketing mistakes guide
Our actionable guide to avoiding common social media marketing mistakes to help you avoid the pitfalls that limit engagement with your target audience.
Access the
Mobile Marketing statistics 2019
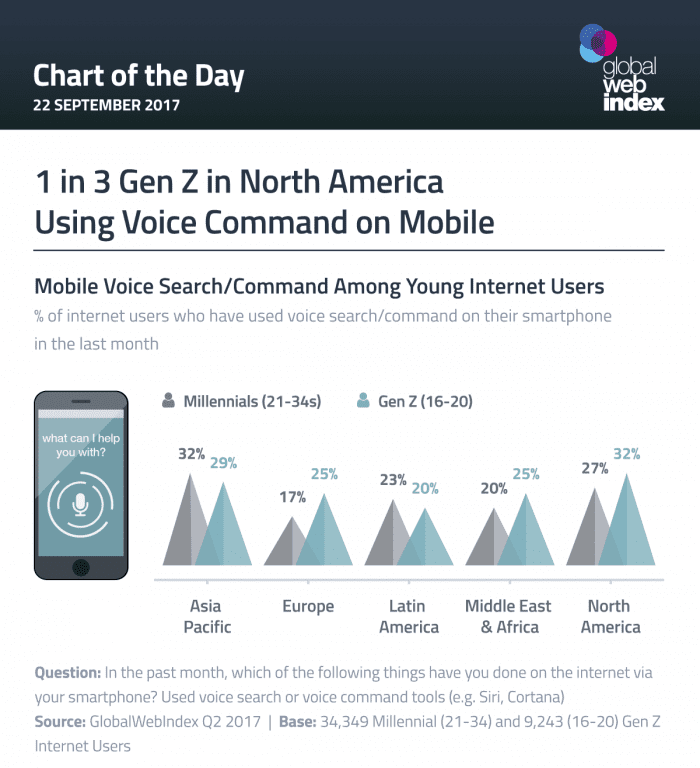
- 1 in 3 Gen Z in North America are using voice command on Mobile (Global Web Index 2017)
- UK users spend almost 2 hours per day online via mobile (Global Web Index)
- Increasing brand awareness and engagement are the biggest objectives for mobile advertising (Brand Quarterly, State of Mobile 2017)
- Mobile now represents almost 7 in 10 digital media minutes, and smartphone apps alone account for half of all digital time spent (comScore, U.S cross-platform future in focus 2017)
- Creating personalized customer experiences (32%) is the greatest long-term growth potential for mobile products (Open Mobile Media, State of Mobile 2017)
- 48% of cousers start mobile research from search engines – (Smart Insights, 2017)
- Targeted mobile ad spend will grow from $12.4 billion in 2016 to $32.4 billion in 2021 – (BIA/Kelsey, 2017)
- Avg. page load speed on mobile sites is 22 seconds – (Think With Google, 2017)
- A 10 second page load time has a 123% higher bounce rate than a 1 second page load time (Think With Google, 2017)
- 69% of digital media time is spent on mobile (comScore, 2017)
- Phones and tablets combined to produce 74% of retailer Google search ad clicks in Q1 2019, an eight-point increase from a year earlier (Merkle, Digital Marketing Report Q1 2019).
Download Premium Resource – Mobile Marketing Strategy Guide
Our mobile marketing best practices ebook is a comprehensive guide to helping businesses exploit the opportunities of mobile commerce.
Access the
Email Marketing statistics 2019
- Only 57% of personal emails are now being opened by recipients and just 37% are viewed as being useful (Adobe, Email Usage Study, 2019).
- 42% of email senders now have a reputation score of between 91 and 100 (Return Path, Sender Score Benchmark Report, 2019).
- Triggered email open rates are, on average, 76% higher than BAU email open rates, despite fewer triggered emails being sent (Epsilon, Email Trends and Benchmarks Q2 2019).
- 82.57% people who receive a welcome email open it, but just 22.76% click through the website (GetResponse, Email Marketing Benchmarks, 2018).
- Over half (51%) of consumers say that email is the best way for brands to contact them, although personalized emails are most effective as 72% of consumers will only engage with personalized marketing messages (SmarterHQ, 2019).
- 40% of marketers agree that email marketing is an effective way to improve lead generation quality (Ascend2, Lead Generation Quality Survey, 2019).
- Being emailed too often is the biggest frustration for people. 38% say they are emailed too often via their work email and 43% say they are emailed too often via their personal email (Adobe, Email Usage Study, 2019).
- 67% of email marketers would like to be able to offer better personalization with their emails, while 60% want to deliver better segmentation (Econsultancy, 2019).
- Only 37% of email marketers have reported an increase in the effectiveness of their email marketing, with 43% reporting that effectiveness is holding steady (ReturnPath, The State of Email Marketing, 2019).
- Average email open rates for bulk sends now stand at 11 to 15%, with 27% of marketers reporting this (ReturnPath, The State of Email Marketing, 2019).
For more email statistics and benchmarks, we have a full compilation of open and clickthrough rates for email campaigns in the UK.
Download FREE Resource – Email trends 2017: A visual guide
Review your approach to email marketing by reviewing the latest trends.
Access the
Influencer Marketing statistics 2019
- Influencers are effective for marketing purposes, but they can easily lose consumer trust. 71% of consumers in the UK and US will unfollow an influencer if it is discovered that they bought fake followers (Takumi,the realities of influencer marketing, 2019).
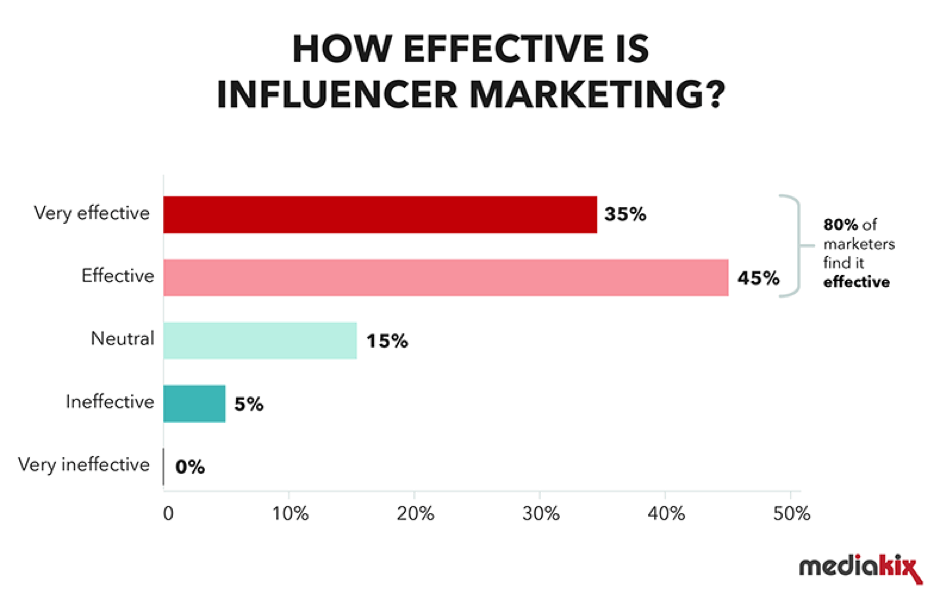
- 80% of marketers find influencer marketing to be an effective tactic (Mediakix, Influencer Marketing Industry Benchmarks, 2019).
- 89% of marketers say that ROI from influencer marketing campaigns is comparable or better than ROI from other channels (Mediakix, Influencer Marketing Industry Benchmarks, 2019).
- Influencer recommendations can encourage purchases, with 82% of consumers saying they are "highly likely" to follow a recommendation made by a micro-influencer (Experticity).
- Influencers are especially effective when marketing to younger demographics, as 25% of children aged between six and 16 say they are most influenced in what to buy by social media influencers (Wunderman Thompson, Generation Alpha, 2019).
- When working with influencers, 78% of marketers said that measuring and improving ROI is one of their top concerns (Talkwalker, The Global State of Influencer Marketing, 2019).
- Over half of internet users say they follow some sort of celebrity account on social, with figures reaching as high as 68% among 16-24s (Global web index, 2017)
- 38.8% of marketers said that influencer marketing is important to their brand or agency (Talkwalker, The Global State of Influencer Marketing, 2019).
- The main objective of influencer marketing for marketers is increasing brand visibility, with 65.8% agreeing with this (Talkwalker, The Global State of Influencer Marketing, 2019).
- YouTubers with over 7 million followers are earning $300,000 on average, Facebook and Instagram accounts with over 7 million followers are also getting over half that amount too (The Economist)
Other digital marketing research 2019 (UX, Video, ABM etc.)
- Video will make up 80% of consumer online traffic by 2020 (Animoto, 2017)
- 96% of consumers ages 18-34 watch a social video a few times a week and 75% of millennials watch video at least daily (Animoto, 2017)
- 18 videos are published per month by businesses (Hubspot, 2017)
- 62% of marketers plan to increase their investment in Facebook video in the next year (Animoto, 2017)
- Facebook generates 8 billion video views on average per day (Social Media Today)
- Users who have a bad mobile user experience are 60% less likely to revisit and purchase from that brand in future (Smart Insights 2017)
- Diary studies are used by just 2 in 10 (22%) researchers and just under half (47%) use search log analysis (NNG, user experience careers)
- Global cart abandonment rates have increased 1.3% (up on the previous quarter) to 76.9% (SalesCycle, The remarketing report)
- VR devices are currently too expensive according to 66% of respondents and the majority (86%) would like to try VR before buying (Ipsos MORI via Marketing Week)
- 17% of users delete apps because they are not useful and 17% delete them because they take up too much storage space (MarketingSherpa, Customer Satisfaction Research Survey)
- Youtube remains the top content distributional channel to add into a marketing strategy (49-52%), within the next 12 months (HubSpot, State of Inbound 2017)
- Over half (52%) of consumers want a fast response to their issues, something that can be hard to achieve with an automated service (Smart Insights)
- 27% of users skip video ads because they don't like video ads that play before the video they want to see (Smart Insights)
- 21% of respondents characterize Sales and marketings relationship as either misaligned or 'don't know' (HubSpot, State of Inbound 2017)
- Marketing priorities include converting leads to customers (70%) and attracting visitors to their site (55%) whilst considerably less (29%) said sales enablement was a top priority (HubSpot, State of Inbound 2017)


