Question: I wondered whether you might be able to point me in the direction of some info on web behaviour?
We've recently been looking at "drop off" rates for some of our online content and seeing if we can compare it with external sites to help gauge whether the behaviours we are seeing could be considered as "typical".
The metrics we've been looking at include time spent on a page (0-10, 10-20 seconds etc) and would like to compare to external websites such as BBC, YouTube, etc.
Do you know how it is possible to obtain this data, or any external websites who may have it?
We measure it, but have no external reference as to whether it is good, bad or indifferent.
Nicola
Smart Insights Expert Answer: Yours is a familiar problem for all analytics users. We hear "What does good like"? "How do we compare"? questions often. So, you need some context, otherwise the answer is always "it depends".
I recommend two approaches, but first let's review the main short-term engagement measures. This is the "Act" step or our RACE framework for improving and improving online marketing. You want your visitors to advance on their journey, connect with your content through searching or clicking through on relevant content. This is distinct from the long-term engagement of returning visits and sales - the E we use in RACE.
Metrics for evaluating initial engagement with a site
In analytics tools, the main measures for initial engagement with a site are:
1. Bounce rate. The percentage of visitors who leave immediately after viewing only one page. Note that if you event tracking, for example as we do to track the clicks on the social icons in the right sidebar, these visits are not rightly not counted as bounce since visitors have engaged.
2. Duration or dwell time. measured as Average Time on Page or Average time on site
3. Pages per visit. Pages viewed divided by the number of visits.
Which is the best to use to review performance of sources of traffic or the ability of a site to engage will depend on your goal. I personally find bounce rate most actionable for seeing whether your providing a good, relevant, experience. So with search marketing you can compare bounce for different keywords entering the site on different landing pages and see which are underperforming compared to others. So benchmark against your own site average - Google Analytics has a good chart for for this.
You might think that duration would be the opposite of bounce, but average time on page can be a good indication for engagement with an article like a blog post or article.
Pages per visit is better for reviewing overall engagement with content on a community site and there are some good sites on this
Benchmarks for engagement
Finally, to the main part of your question, where do we find benchmarks for these?
1. Bounce rate.
Jan 2012 Update: Google published a compilation of bounce rates by source in summer 2011 in their Analytics Enewsletter - Malcolm Coles did a summary of how bounce rates vary by source and country.
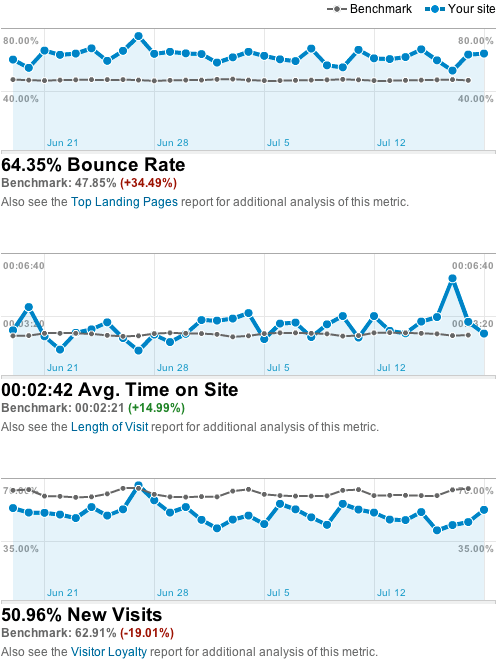
Published bounce rates aren't widely available, but if you use Google Analytics, one option was to enable the benchmarking facility to compare to a similar sized site in your sector. Here I share ours for Smart Insights:

This has a typical bounce rate for a blog : 60-80%, since many visitors are referred from search or Twitter, check out the article and then disappear. We also have a lowish average time on site although new visitors often go onto browse the About Us or top nav giving our advice on other topics. Check out our post on using the Dimensionator to understand the popularity of the second page viewed - important for engaging visitors.
See the last section of this post about the danger of averages where I present some other examples of typical bounce rates.
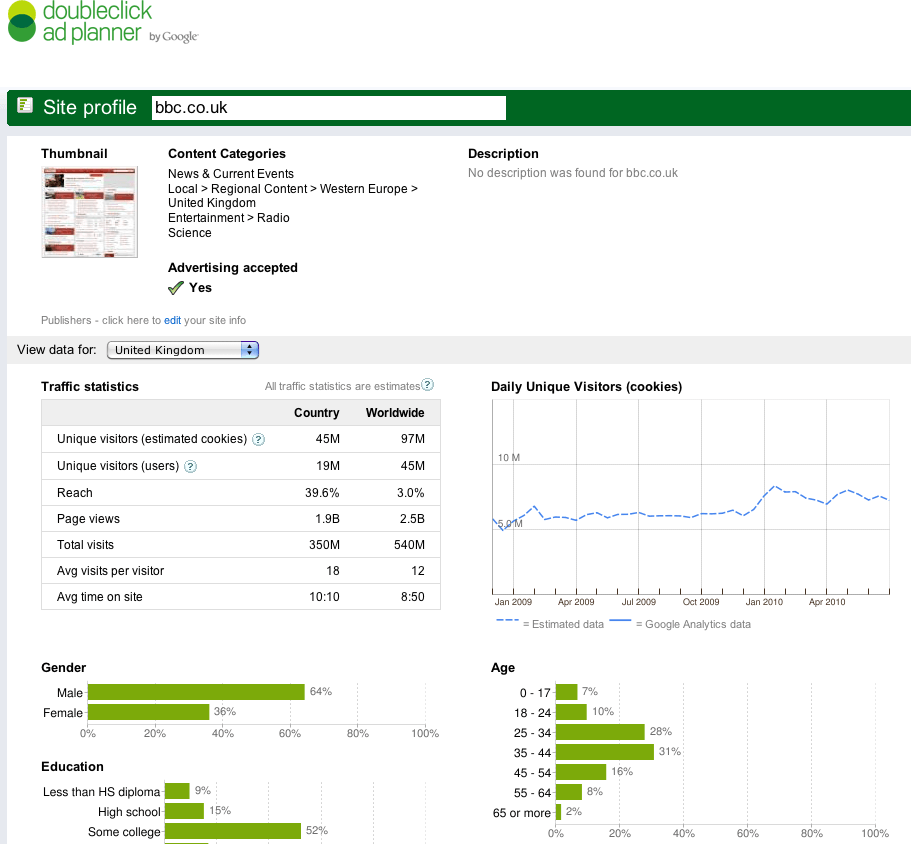
2. Duration or dwell time. The single best source for benchmarking duration is the Doubleclick Adplanner (short cut = www.google.com/adplanner) . For all sites with more than a 1,000 visits a day average time on site is presented, so it's great for comparing to direct competitors with a similar offer. Here we see the BBC has an impressive dwell time of 10 minutes per visit.

3. Pages per visit. You can see that by dividing Page Views by Visits we can also calculate this measure; around 5.4 in this case. You can also benchmark out of sector. For example, if your site has a community section - how does it compare to Facebook which has a typical pages per visit value of 30.
So I hope that answers your question Nicola. Clearly these engagement measures aren't going to differ radically from week to week, there more useful for benchmarking before and after major site design or content changes. But don't forget...
The danger of averages - you HAVE to segment for meaningful engagement
To make these engagement measures more meaningful you have to segment - these are our recommendations on the main segmentation options for online marketing and analytics. Of these, the most important ones to test and action for bounce rates are:
1. New vs returning visitors
2. Brand search (they know you - bounce rate can be less than 10%) against non-brand search (they don't know you - bounce rate can be higher than 80% if you're not credible)
3. Different media channels - bounce rates from Email campaigns tend to be lower
4. Customer and non-customers (if you're using custom variables)
5. Entrance page - home page entrances tend to be lower than landing pages for example.
I would look at average bounce rates for all of these - they give you a starting point to improve on and you can focus initially on the keyphrases or pages with a high volume that don't engage. That's the power of bounce rate - it will vary dramatically across your referrers and pages so is highly actionable.
You may also be interested in this compilation of average bounce rates for a range of mainly UK sites tracked with the Analytics SEO software. The average bounce rate is 48% across these sites.


