New research shows why Number One in Search matters and suggests how we should report search effectiveness

Naturally Number One is the position all businesses want for their keywords. But, it's not so easy to achieve in practice: anyone managing a website will understand the joys & heartaches of trying to get this ranking in Google.
I wanted to flag up this data since it quantifies how important the Number One position is and has implications for how you should be setting targets and reporting on SEO for key generic head terms and long tail terms too. I've also linked to a spreadsheet to help you apply this.
This new research is also timely since it's some time since good quality data on the clicks / importance of ranking position has been released. Can you remember when AOL accidentally published their data in 2006.
The ranking report from Optify
The report completed by Optify can be downloaded here, the data covers:
- December 2010 searches
- Google (US) only
- A small segment of total market searches
The methdology was based on reviewing visitors from organic search to company websites
and mapping those keywords against their rank on Google US SERP (search engine results pages). They then analyzed the average and median click through rates for those keywords based on their position on the SERPs.
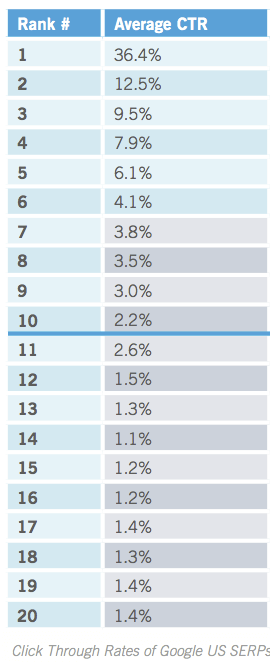
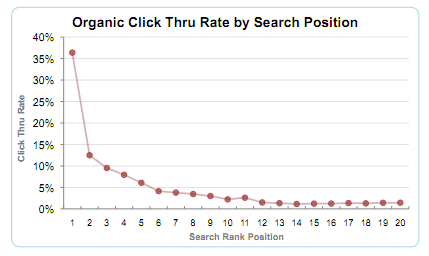
This is how clickthrough rate varies with position:
The Importance of ranking #1
The first key learning from the data is hardly surprising and I would imagine from your own browsing experience you will expect this. Over 36% of clicks occur on natural search result 1. Another 40+% is then split over the rest of the first page.
A key finding from the research is the difference between head & tail term click-through rates, again something quite obvious but its always been difficult to put a number on it. The data states that for tail terms with less than 100 searches per month the click-through rate of position 1 actually drops to about 25% though considerably more people click on a result on the first page compared to keywords with over 1,000 searches per month. Clearly, when searching for long tail terms people have a more precise idea of the website they want to visit and therefore take the time to find it on the SERP's.
Applying and using the data
This data should be used for two key areas:
Forecasting:
Using tools like Google Keyword tool to get the number of searches in your local market per month (remember to look at exact match) and overlaying the data supplied in this report you should be able to create a forecast for traffic to your website. Then, by overlaying conversion rates & average order values you can quickly arrive at a financial forecast for search as well. (consider different keywords convert at different rates, always go for a low bar)
I would recommend when completing such a forecast you create low, medium & high bars. This will allow dialogue with the team / agency as to what feels achievable & why. Checkout this simple spreadsheet to help you with your forecasting.
Focus
While forecasting assumes you are starting out or in planning mode most of us are well progressed with the year. I would therefore recommend using this data to identify potentially quicker / easier / alternative routes to hitting targets. Thinking of your previous learnings & with your strategy in mind, use a similar spreadsheet as the one mentioned to earlier to identify whether focussing on 15 low volume key-terms and boosting them from position 5 > 1 would be easier or more effective than trying to get 1 large volume keyterm up to position 1.
Reporting
As is common practice within rank checking tools, this analysis shows the value of selecting top X keyphrases and then grouping performance in this way:
- Number, % in top 1
- Number, % in top 3
- Number, % in top 5
- Number, % in top 10
- Not ranked
Looking forwards
While this data is obviously current & indicative we can use it to get rough ideas, it will however be interesting to see how any design updates Google make change the numbers we have just discuss. Only a few days ago we blogged about the current design testing Google are carrying out, see the full post here.


