A new, free report on digital media and technology use [@SmartInsights statistics alert]
Value: [rating=5] For students, researchers and marketers who need to convince others of the importance of digital media
Recommended link: Ofcom 2014 digital communications statistics report
If you need hard facts and charts for reports and presentations to convince others of the growing importance of digital communications and technologies in influencing the purchase decision today, the Ofcom Communications report is one of the most comprehensive sources available. That’s why we feature it at number 1 in our Top 10 Free Digital Marketing Statistics sources listing.
It’s published each August for the UK and includes an international digital media statistics benchmark in its December edition.
The latest update for the UK has just been published and in this post I have selected from the 61(! ) charts available to ask what I think are some of the of the most important questions about trends in digital communications which we hope could be useful for your next presentation.
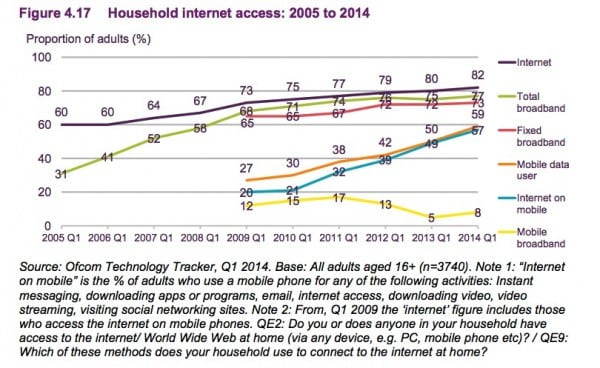
As expected, broadband access now accounts for nearly all access, but what is interesting in the latest data is the continued sharp growth of mobile Internet use which now accounts for over half of all access “Internet on mobile”.
Question 2. How much time is spent online?
This is a surprise. Browsing time on desktop actually fell by 14.7% and the difference was not made up by the 2.5% growth in mobile Internet browsing.
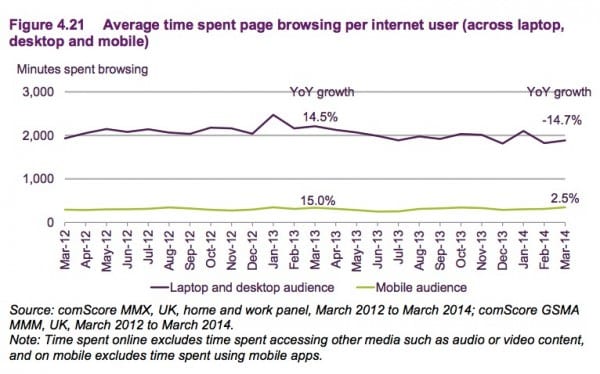
I would speculate based on other data from Pew Internet that this would seem to reflect more time spent in messaging apps such as Whats App, Viber and Snap Chat.
Total browsing time per month at 31 hours 24 minutes is certainly significant at over a day per month, but leaves plenty of time for other activities, including consuming traditional media.
Question 3. Which digital devices are used to access the Internet?
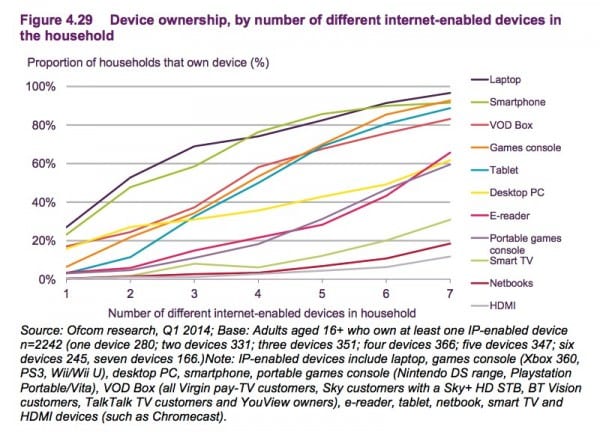
The Ofcom research has a lot of detail on the type of device used to access the Internet in each household. As you will know multi screening and multiple digital device use is commonplace. This data shows that there are now multiple laptops, tablets and smartphones in each household
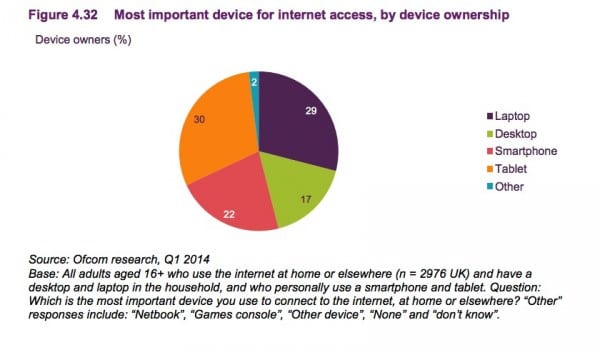
If we look at this from an individuals’ point of view of their primary access we can see that mobile (smartphone or tablet) is the primary Internet access device for over half of users 52%).
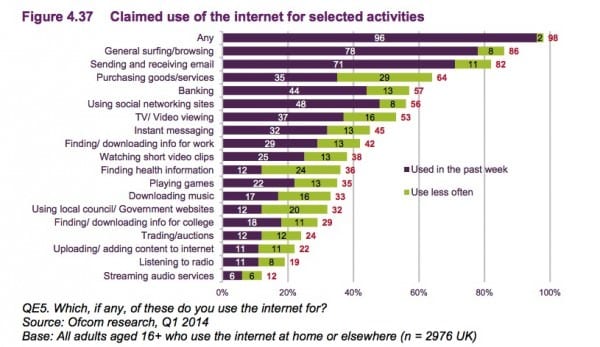
Question 4. Which activities is the Internet used for?
I have been covering this in my books for a long time now and the picture doesn’t change that greatly. What’s interesting though is frequency of active use.
Ofcom used to ask about using the Internet for different activities in the last 3 or 6 months, but now it’s interesting how frequent these activities are in the last week showing really active use:
- 48% have used a social network in a last week
- 44% have banked online in the last week
- 35% made an online purchase in the last week
Question 5. Which search platforms are used?
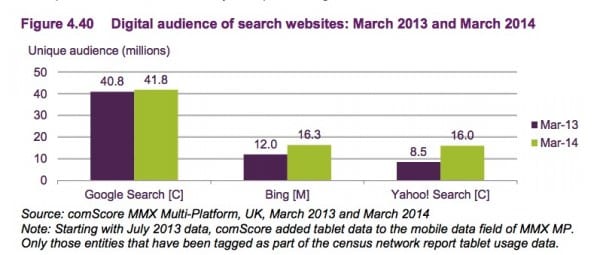
We tend to think that Google accounts for the vast majority of searches, but this data reminds us that Bing and Yahoo! are still significant platforms to reach audiences online.
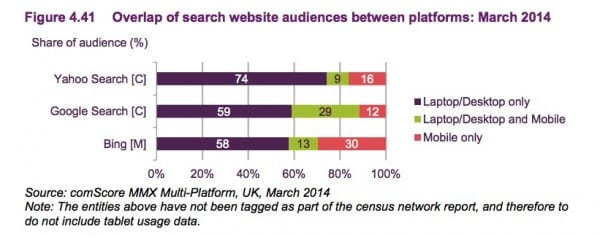
We also get a picture, courtesy of the comScore MMX data or the importance of mobile search. Mobile only use is still relatively low on Google at 12%, but up to 30% on Bing.
Question 6. How many people in different age group use social networks?
We’re often asked this question so it’s interesting to see this breakdown.
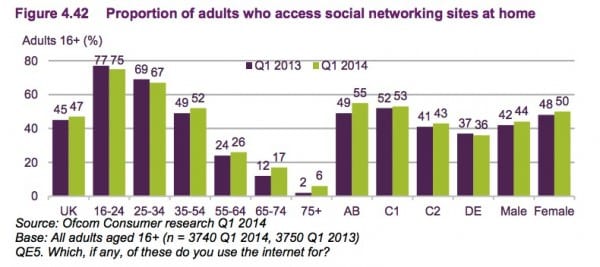
The popularity of social networks are broken down also. All the main social media networks continue to grow in the UK.
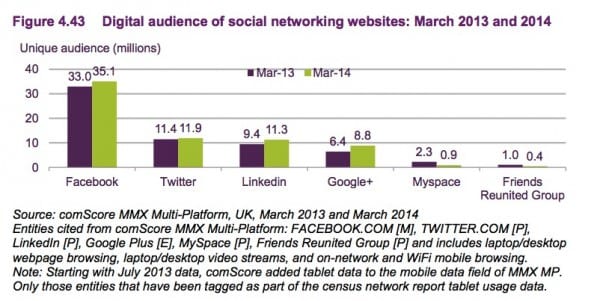
A full breakdown by Gender isn’t available unless you subscribe to comScore or you can check out our Global WebIndex compilation of Social media use statistics.
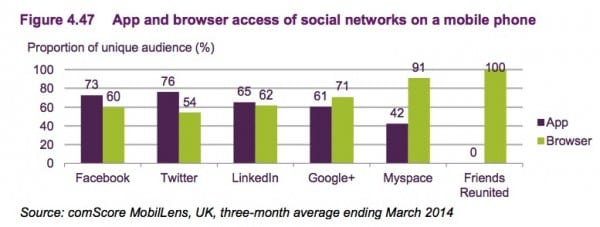
Social network access via mobile dominates whether it’s app or browser.
Question 7. What is the expenditure on digital media?
Given the increasing Internet use we have seen in the other charts a final question looks at the overall importance of digital media.
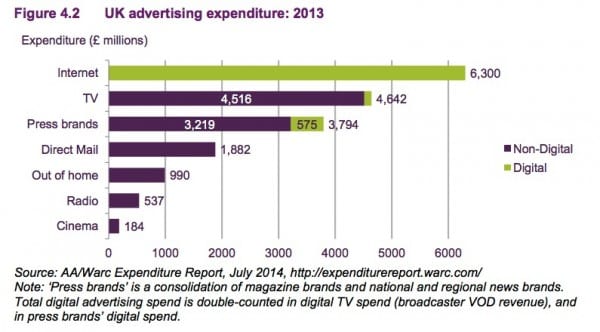
This data via WARC shows that digital media are now the leading media, but with TV, press and direct mail still significant. I’m not sure I believe the prediction that 75% of media spend will be online within 5 years, since it’s a big shift in a short time, but the other charts certainly show increased investment is warranted.


