Your options for visualising and better understanding the combination of media that assist sale across multiple touchpoints on the "path to purchase"
Back in 2008 I did an interview with Gary Angel, an analytics consultant at Semphonic, where I asked him about attribution approaches. What he said two years on is still equally relevant:
Attribution remains a significant issue for clients. In our view, there is no one right answer to attribution. We all know that first or last doesn't cut it. But it turns out that channels interact quite differently for different organizations. It also turns out to be nightmarishly difficult to produce coherent reports on channel interactions that capture anything like reality.
Building an attribution model usually seems to involve a significant company-specific deep-dive analysis followed by the creation of a set of business attribution rules that are applied to ongoing reporting. This is an area where we tend to emphasize Analytic Reporting (reports that have a model built-in using programmatic code) to achieve reports that capture the complex reality but can actually be digested.
This challenge certainly remains in 2010 and I expect to gain increased attention in 2011. But the difference now is that there is a wider range of tools to help with this challenge.
What is digital media channel attribution?
Digital media attribution is a method of evaluating the combination of online touchpoints which influence or assist conversion to sale.
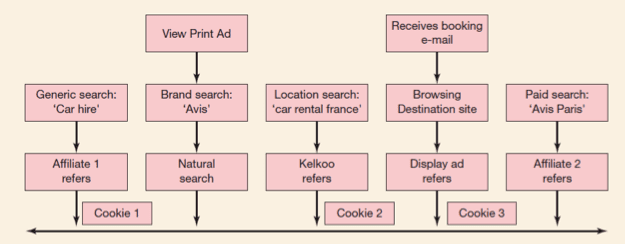
To take an example, from my Internet Marketing book, here a search for a car rental the overall customer journey or "path-to-purchase" can involve multiple touch points from an affiliate to natural search to a banner ad.

Why is media channel attribution important?
Many companies who are investing a lot in digital media, and in particular display advertising or generic PPC keywords naturally want to know more about which investment is driving sales. If you use the last-click attribution model, which is the default in Google Analytics, then you can't determine whether previous impressions or clicks in other media have contributed to sale (although the new search funnels have improved this.
How can we visualise our customer path to purchase?
So where to start? The first question the marketer has to ask is...
Q1. How complex are our customer journeys?
If customer journeys are relatively simple with the majority converting on the first visit, then it's unlikely that attribution modelling will give you such a great return on investment.
This is most likely where it's a simple purchase such as flowers and where a trusted brand is involved with limited price or feature comparison.
There are four further questions I'd recommend to help undertand the details of customer journeys. I've collected these examples over the last 5 years or so because I think the trick with attribution is to use the analytics to create visualisations which summarise the complex customer journeys through time.
Q2. How many visits involve a single visit before conversion?
If, when you investigate the number of visits per purchase, you find that over three quarters convert on the first visit the need for a conversion attribution study is going to be relatively small.
As a rule of thumb, if more than three quarters of your visitors convert on a single visit then channel interactions are less important.
Here"€™s an example of a relevant report from the Ecommerce menu, Visits to Purchase report in Google Analytics. In this case, the mast majority of conversions occur on the first visit and attribution is less important.

Q3. Number of touchpoints are involved before conversion?
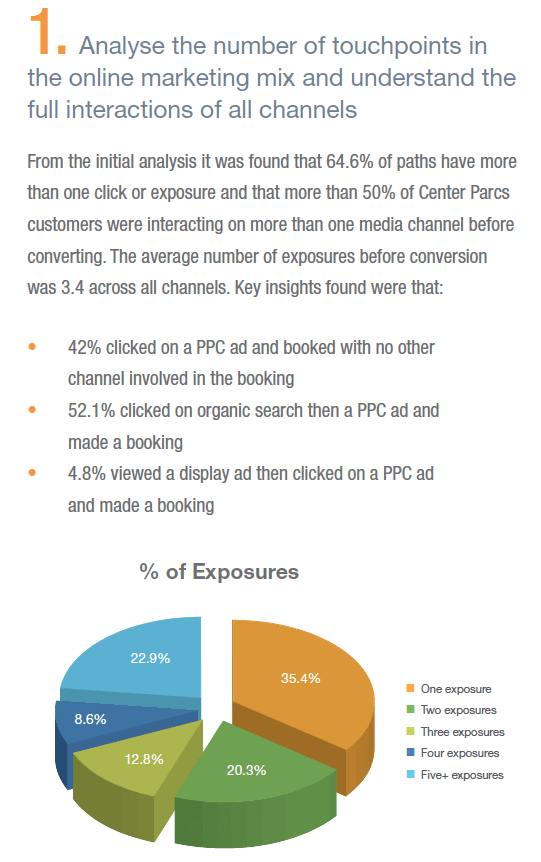
The next level of detail is to understand how many touchpoints or interactions with a brand occur before conversion. There be some interactions on other sites, particularly display ads which aren't recorded in the site analytics.
Here is another example where only around a third of leads involve a single visit (or in this case a single exposure since "view throughs" where someone sees a display ad but doesn't click on it) are included.

In this case a more detailed review of attribution is warranted.
The source of this analysis is the excellent Search Ignite attribution case study for Center Parcs (http://bit.ly/betterattribution).
As a relatively high cost family holiday a Center Parcs holiday is a higher value, more complex, considered purchase where the purchase path is longer.
Center Parcs offers a high value product with its audience tending to do a lot of research before purchase. 70% of bookings are made online, whereas four years ago it was less than 20%, so it's vital to the business to understand which media are influencing the purchase.
Center Parcs wanted see the value of using more expensive generic keywords on the final conversion. 60 days worth of data was analysed and to see how different channels performed. Their contribution can be reviewed and credit given where its due, for example, the system allows them to give 50% credit to a display ad view, and then give more credit to a display ad or PPC ad which has actually been clicked on, so that the various channels each get some credit for the sale.
Q4. What is the different sequence of media prompting conversion?
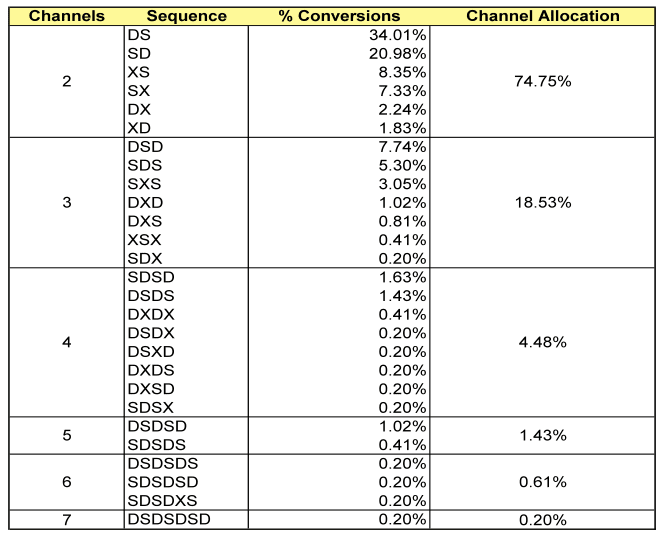
The next stage of analysis is to consider the sequence of media. This is an excellent visualisation presented by agency Media Vest (MVi) at Ad Tech way back in 2006 for a travel client showing that brands with large budgets have been using this approach for some time.

In this visualisation, D stands for Display (banner) ads, S is paid search and X an aggregator or comparison site. The percentages are all sales that take more than one visit to convert. You can see through the DS sequence, which equals display followed by Search visits that this approach is relatively common and suggests the importance of display ads prompting a later search. This view is missing completely on a "Last click wins" model.
Q5. How do search journeys vary during the path to purchase?
At the final level of detail it can then be worthwhile understanding the role of individual channels better, and in particular paid search. A further analysis will also look at the latency or interval between visits.
Marketers need to understand how consumers use different types of terms as shown in the table below which shows the repeated use of different types of search terms for a single customer (other digital channels such as affiliates are ignored here).
Example of weighted allocation of different searches
| User id |
Search query |
Sale? |
Value attributed: last click method |
Value attributed: weighted method |
| 123 |
Mobile phone (generic search) |
No |
£0 |
£40 |
| 123 |
Best camera phone (category generic search) |
No |
£0 |
£40 |
| 123 |
Nokia phone (product search) |
No |
£0 |
£40 |
| 123 |
Nokia N91 Orange (product + supplier search) |
No |
£0 |
£40 |
| 123 |
E-retailer brand name (branded search) |
Yes |
£200 |
£40 |
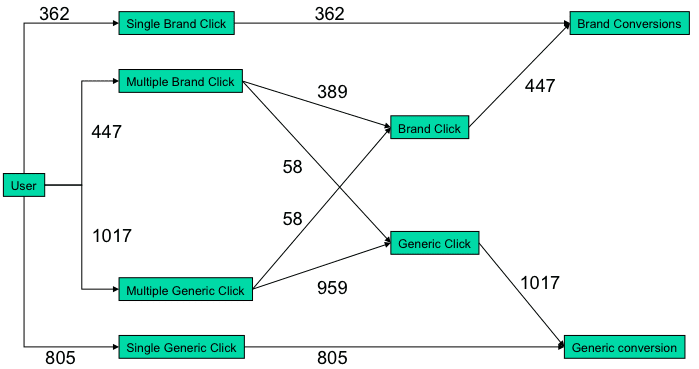
An additional way to visualise this across a rage of keyphrases is to classify them as generic, long-tail (complex 4+ keywords) or brand. This can give you this type of visualisation:

Here you can see that a significant proportion of 447 conversions occur through a final brand click preceded by single or multiple generic clicks. If the effect of these generic clicks had been assessed using the last click model their contribution to sale would be missed and advertisers may stop advertising on them and using their sale. This is a reason that Google introduced its Search Funnel reporting options in 2010 to encourage marketers to invest in these generic keywords - see http://adwords.google.com/support/aw/bin/answer.py?hl=en&answer=173376.
This form of analysis is also possible with the Tagman tag management tool and you can read a case study of how retailer Boden used it to assess the value of generic clicks in influencing sales at http://www.tagman.com/index.php/the-business-case.html.


