4 steps and 4 data sources to help define the business case for SEO
Search engine optimisation is one of many digital marketing tactics a business can choose to focus on. Email, pay per click, display and affiliate marketing are all in many companies' marketing armouries, and while the cost per visitor for natural search is zero, in order to achieve organic success within the SERPs significant investment is required. This post looks at one aspect of making the case based on my recent experiences.
‘Black hat’ SEO tactics such as buying links, keyword stuffing and cloaking used to work for those looking to get visibility within the search results, but now a more considered approach to on-page optimisation, content marketing and link earning is required to rank highly for popular search terms. Therefore, in order to get investment and buy-in for SEO it’s not surprising that business managers require a compelling case as to why SEO should be pursued.
How to find the size of the SEO prize?
Before you can start building the case for SEO, you must first get their attention by illustrating the ‘size of the prize’.
To do this, carry out an audit of your website and use your web analytics to identify what natural search is currently contributing to the business. By understanding how much value SEO currently contributes in terms of visits, conversions, leads and sales, you can begin to understand where you currently are and where potential improvements can be made. You can learn more about auditing and setting goals in the Smart Insights 7-step guide to SEO.
Building the case for SEO investment
Once you have carried out an audit and so created a baseline to measure against, you can start putting together a case, with numbers, to illustrate how improvements to natural search by using SEO can positively impact the business.
There are four key steps to follow:
1. Focus on Google - for now
According to an Experian Hitwise study in October last year, Google provides 89.33% of all web searches in the UK. Whilst it’s important not to become too myopic and build your site around just one search engine, it makes sense to recognise Google’s current dominance in the search space.
Therefore, for the purpose of this post, I've decided to consider just Google in my calculations and I'd suggest you do the same for the time being.
2. Estimate potential search volume for top terms
Assuming you have already conducted a keyword gap analysis to identify the terms most relevant to your site, the next step is to estimate the potential search volume for the top search terms you want to optimise for using Google’s Keyword Tool.
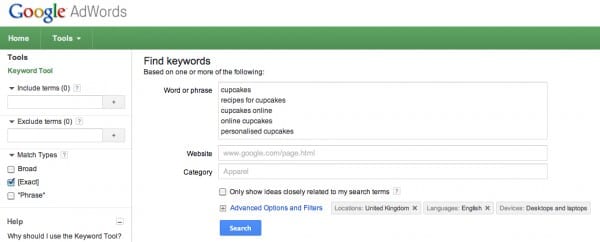
Take each of the main key phrases and drop it into the tool:

Select the UK for ‘location’, click [exact match] for 'match type' and hit ‘search’:

The output from this activity will give you an indication as to the number of searches specifically for those key phrases per month. Remember that ‘Local Monthly Searches’ refers to the UK and it is this figure you should consider.
3. Estimate Google Click-through rate percentage
You will be competing for only a share of the number of searches from the Google Keyword Tool activity we looked at above. So the next task is to determine what percentage of those monthly searches you can potentially get to your website.
One way to do this is to consider the click-through rate from organic listings on page 1 of Google.
An Optify study in 2012 showed a position 1 ranking achieved 36.4% CTR, over 24% more than position 2.
Meanwhile, SEOMoz released research showing average CTR % for brand, product and general searches, indicating that websites ranking in position 1 had a 52% CTR.

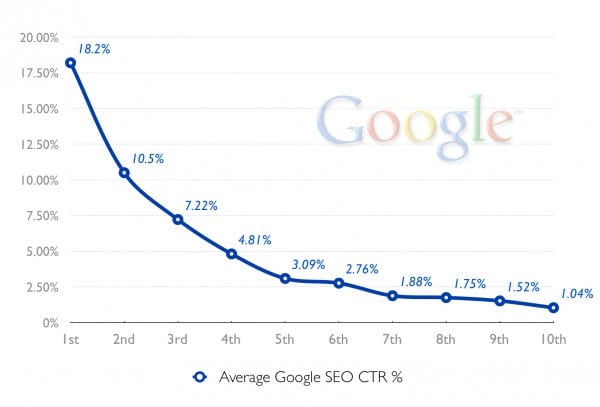
However, iThinkMedia, a UK-based search marketing agency, provide figures based on research they conducted with a range of clients, which indicates similar results to the studies above with the exception of position 1 rankings.
The 18.2% click-through rate for position 1 is certainly more conservative than SEOMoz’s 52% and Optify’s 36.4% but that’s not necessarily a bad thing as in my experience it’s often better to under promise and over deliver when making predictions such as these!

The chart above does not break out brand and non-brand terms, and is also not sector specific. And of course there are many other caveats to be aware of (for example, this approach fails to consider the impact of universal search, search intent or the effect of rich snippets on CTR).
Nevertheless, the chart still provides an approximate idea of potential CTR based on where you rank on page 1 of Google and is a good starting point for anyone considering the impact of rankings on traffic to their website.
(For a closer look at sector-specific CTRs for rankings, check out this excellent post featuring a really interesting and useful infographic).
4. Calculate potential traffic and sales
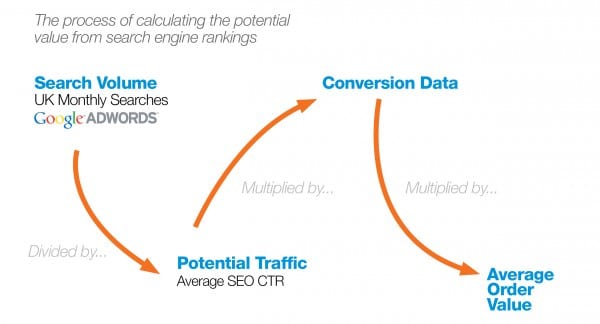
The final step is to put all the data together in a format where you can clearly show what traffic can be obtained from appearing 1-10 on Google and how this translates to traffic and sales.
The last piece in the puzzle is to calculate how each main key phrase converts. This is something that can be done when carrying out an initial audit of your website's current SEO performance.
Working out the conversion rate of specific sets of key phrases will allow you to determine the potential traffic and revenue return by ranking in positions 1-10 for the highest volume search terms.

Finally, once you know the conversion rate this can then be multipled by your average lead or order value to give you a rough indication of how sales could be affected by improved natural search traffic for your top key generic search phrases.
Her's a summary of the process I followed.


