The conversion report in Google Analytics is probably the most important report in the entire service. The conversion report shows you the percentage and absolute numbers of visits which converted into a set of defined goals for a website. Goals can be any marketing outcome related to lead generation and sales from enquiries through to video views.
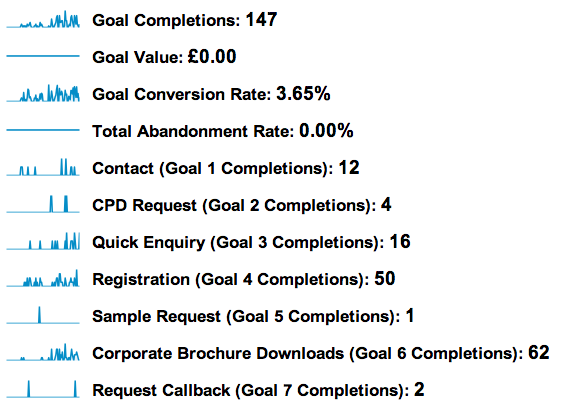
Here is example of the goals in a typical conversion overview report:
This particular website converted 3.65% of traffic (conversion rate) into performing some sort of action which I have determined as a goal for the website. A total of 147 goals (absolute number) were completed in this particular month and this is one of many metrics used to measure the performance of the website month on month or quarter by quarter.
What about the conversion rate for just the enquiries?
The issue that I have with the above conversion report is that it’s difficult to view the conversion rates for each of the goals, especially the lead generating goals.
Whilst it’s good to focus on absolute numbers, it’s also interesting to see the conversion rates for each specific goal. You can then refine marketing initiatives to improve each goal or a set of goals for example.
Enter the wonderful facility of custom reports.
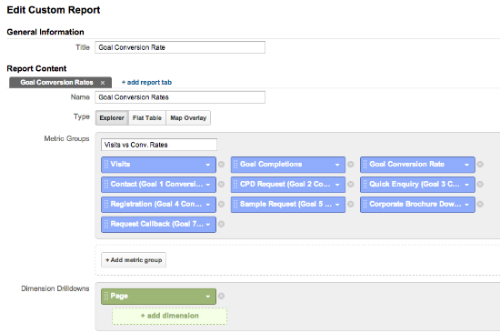
Set up a custom report with the following metrics depending on the goals you want to view the conversion rates for:
Note: Select ‘Page’ as a dimension as you can’t save a custom report without selecting a dimension. You can ignore this data in the report if you wish.
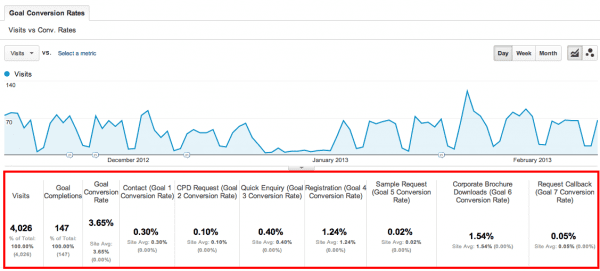
Once you have created your custom report you can hit save and you will then be presented with something like this:
Voila! Now you can see the conversion rate by goal. To get a conversion rate for your lead generating goals all you do is add the conversion rates together. So in this case it’s 2.11% (goal 1 + goal 2 + goal 3 + goal 4 + goal 5 + goal 7).
The website converts 2.11% of traffic into sales leads.
When reporting, it might be useful to report both conversion rates and absolute numbers purely because traffic generating tactics will skew numbers for any particular month. A classic example of this is when social media activity is increased. Great as a traffic driver, probably not so for conversions thus resulting in lower conversion rates for that month.


