A reminder to factor in variation in conversion from mobile when modelling sales from mobile site visitors
Reviewing the latest statistics on increased use of mobile is useful for making the case for mobile marketing. Earlier in the week I shared 4 key sources on mobile platform usage.
What's of most interest to site owners though, is what happening in their sector, and on their site in particular. In this post, I'll share two examples. The first is most relevant if you work in travel. It's an infographic from Skyscanner. The headlines are:
- 30% of Skyscanner visits now from mobile (50% in some markets), but...
- Mobile users are 39% less likely to book
It shows that, of course, you have to look at both volume and quality of traffic when creating the business case for investment in mobile.

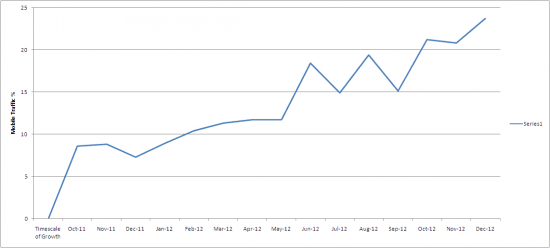
The second company example, shared by an Expert member, is also a consumer sector, but is anonymous. But I thought interesting to share since it shows a real example of the growth experienced and how it's necessary to make site changes.

In this case, 72% of that traffic has been from iPad and iPhone devices alone. Samsung and Sony Eriksson are distant 3rd and 4ths.
In this case, my contact asked their agency to add Mobile CSS, Viewport Meta Tags and Apply Icons on their site to help improve the mobile experience. This change gave a step change of around 25% reduction in mobile device bounce rate with the improvements. I don't have data on conversion in this case.
So the takeaway, is to review more than the volume of the mobile visitors, you also need to look at their quality in terms of engagement (bounce), conversion (to lead and sale) and value (revenue per visit). You need to set colleagues expectations around these too.
I'm sure many other companies are seeing these trends too showing the importance of testing and improving the site to deliver the right experience for these visitors while not degrading the experience for desktop users...


