Using RACE to structure your social analytics
 Social analytics is still relatively new and yet there are already many tools offering to give you the insights to empower your marketing.
Often, these tools won't give you a full picture of how your social media marketing is contributing to your business since they only look at one channel like Facebook. As I work with clients, I find you need to use a range of tools and integrate the data to provide a unified report. As with everything in analytics, 20% of the data will generally give you 80% of the answers you need. So it's necessary to identify the "measures that matter". In this post I'll outline the process and measures I use at First 10 to enable the required level of analysis for our clients.
It all starts with clear, commercial objectives
Without objectives it is impossible to get value from analytics; you can walk away after browsing data and reports from a tool with nothing but hours of your life gone, never to be seen again! Objectives should stem from the business and into the marketing plan of which social will feature. When considering objectives I find it easier to break them out into three categories:
- Brand - How you want people to feel / talk about you & the position you want in the market
- Commercial - Cold hard cash or volume of leads, this can be new or repeat so LTV
- Marketing - customer communications on website, social outpost and their performance
For understanding the right types of measures to use within social media marketing, I recommend taking a look at Jeremiah Owyang's Social Media ROI pyramid to make sure you have the right blend of metrics related to brand, commercial and customer communications. A "must-read"!

Utilizing the RACE Framework
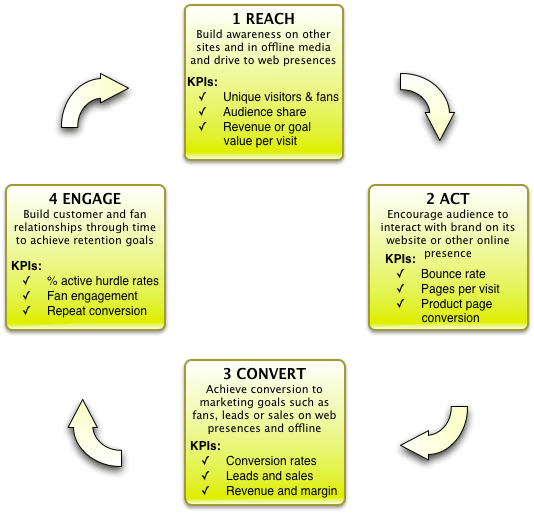
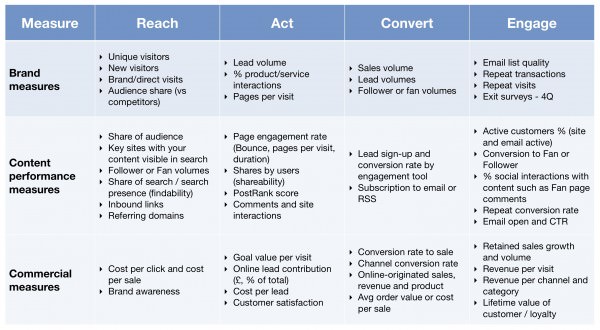
Reporting requires a level of organization, which is why Smart Insights developed the RACE (Reach, Act, Convert & Engage) for digital marketing reporting. This framework allows the right questions to be asked of your social analytics, putting them in the relevant context. I have listed some examples below. We find the KPIs you need to report on across RACE for social media marketing are similar to content marketing KPIs that Dan has described previously:

So what does this look like in practice when we report on customer campaigns involving social media. These are what we think is a minimum set of KPIs:
Reach - how are we growing our audience and changing perceptions?
- Number and quality of Fans / followers / ambassadors
- Increment in social visitors to your website(s)
- Brand and product mentions (across the web, news, blogs, portals, social)
- Brand sentiment
- Brand-related searches
- Video views
- Inbound link growth
Act - how are we encouraging interaction with the brand?
- Sharing from your website / hub
- Comments on content (on your website / hub)
- Comments on social networks (Facebook, YouTube etc)
- Retweets
- “People talking about you” (Facebook specific)
Convert - how are we influencing sales using social media?
- Leads/sign ups from referral and social
- Lead conversion rates to sale for these channel
- Traffic conversion to sale from referral & social
- Event / Webinar participation
- Social value - Last interaction and Assisted social conversion £, $, € for example from Google's Social Analytics
Engage - are we building repeat interactions and sales
- Repeat visits and sales generated through social media
- Sentiment changes - advocates/testimonials and negative sentiment
- Dwell time with the brand
It cannot be automated & no one dashboard will be the same
Businesses today focus a lot on automating as much as possible. Well so do we, but the reality is that unless you have the budget for a large data warehouse project, a good chunk of this reporting from different sources is currently manual. We find that there is no single tools that will pull enough of the feeds in the right formats to automate this for you. If there is we'd like to hear about it! There are some that do a large percentage such as Raven Tools which we use, but that can't pull comments from your site and Google+ data for example. There is no harm though in using tools do some of the work and then fill the blanks in manually.
There maybe light at the end of the tunnel though, Google is currently developing a tool that will allow data on the interactions that start on your own site but then continue off site. An example of this would be if I +1’s a Smart Insights blog post from the website & then Dave were to +1 and comment from within Google+ that data would typically not be reported on. You can learn more about the analytics social hub here and it will feature in my future post on social analytics.
To summarise - do not report on everything
Just because it can be monitored and reported on, doesn’t mean it should be. Spend time getting your objectives right, use RACE to align the right & select few metrics that matter and stick to them!
In my next blog post I will look at tools we have reviewed and ones we use to source & interact with the metrics & data behind them.


