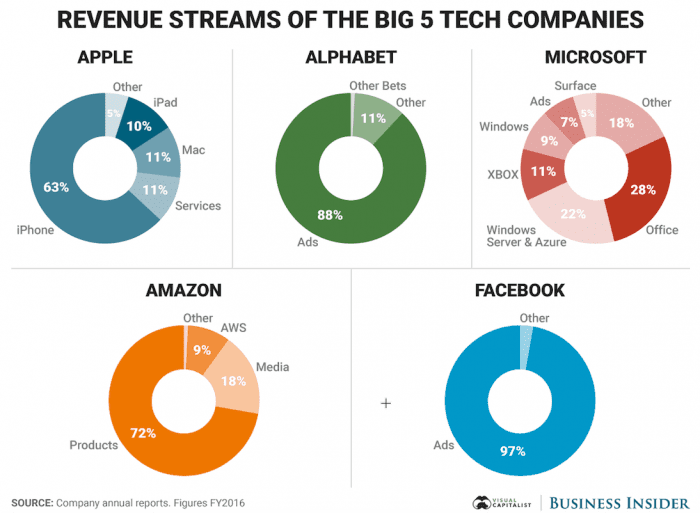
Chart of the Day: How do Amazon, Facebook, Google, Microsoft, and Amazon make their money?
In this article, I defined Eight online revenue models along with how they are calculated, so they could be applied to new revenue models of startups.
In this chart of the day, we can see a comparison of the four / five dominant digital brands sometimes known as GAFA of FAMGA or even the frightful five.

Of these five digital businesses, it's no surprise to see that Alphabet (Google companies including their research and development) and Facebook are dominated by ad sales. Apple sales are dominated by product sales with iPhone much more important that Mac laptops and iPad. Data services like iTunes and storage are still relatively small (11%).
Amazon is different to the other four in that it focuses on online retail, yet this is less than 75% of sales showing its success in diversification to media (18%) and Amazon Web Services (9%). Microsoft has the most diverse revenue from both software, hardware and media. With 22% from Windows Server and Azure, Microsoft is successful in B2B services also.
Research source


