How to use Custom Segments in Google Analytics to check the impact of Google's mobile-friendly algorithm changes live since April 21 2015
Well, the mainstream media have been calling it 'Mobilegeddon', which maybe overstating it, but it's going to increase the questions by colleagues about 'have we been affected by this Mobilegeddon update?'. So, we definitely recommend checking in your analytics, now it's live to see what the impact is on you or your clients.
To help businesses prepare, we featured Google's guidance on mobile-friendly when it was first announced in November and more recently, Gavin Llewellyn explained 5 tools to help check your site is Google mobile-friendly.
I've been anxious to check the impact on SmartInsights.com too, so I thought I'd share the approach I've used and share what we found.
3 steps for using Google Analytics to check the impact of Mobilegeddon
The analysis used involves isolating the organic traffic from Google which arrives at a site from searchers using Smartphones. We've found that we only see the 'mobile-friendly' label in the search results on smartphone, not on large format tablets like the iPad.
Step 1. Create a custom segment for Smartphone visits
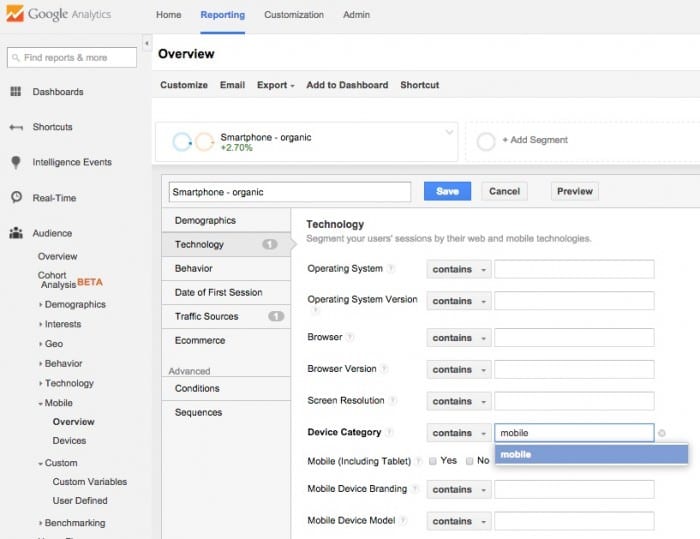
To isolate the traffic, create a custom Segment (formerly Advanced segments) by choosing '+Add Segment' from the bar at the top. We've called the segment 'Smartphone - organic'.
You'll need to choose the 'Technology' segment options and then choose 'Mobile' from the device category. Confusing since this is actually the Smartphone visits - Tablet and Desktop are the other options.

We created this segment from from the default Audience, Overview page, but you may also want to view visits for this segment in other reports like Acquisition, Behaviour and Conversion.
Step 2. Add organic traffic to the segment
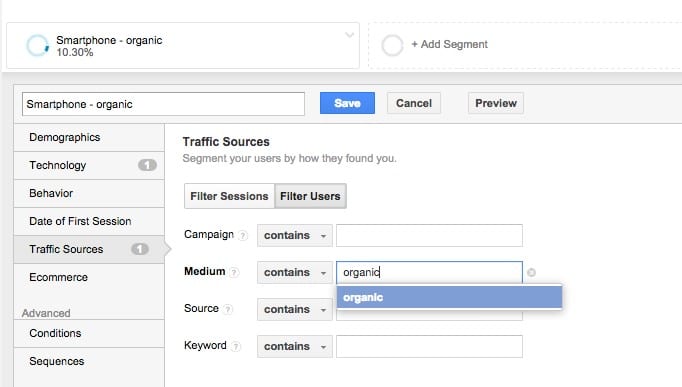
Organic traffic is in the 'Traffic sources' segments tab, so you'll need to click this and then choose a Medium of organic which are 'SEO' visits.

Of course, organic includes other search engine traffic, but with Google accounting for 90%, this approach is fine to identify the change.
Step 3. Review a year-on-year comparison of visits from this segment
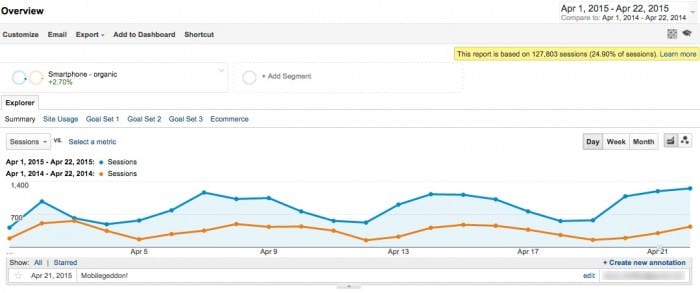
Once you have saved the segment you can then review the trends through time. Due to fluctuations in the days of the week, time comparisons are the best option - you can compare to the previous month, or as in this example the previous year.

I've added a new annotation Mobilegeddon which is good practice for all Google changes and major site changes.
You can see that for the two curves for our 'Smartphone - organic' segment there is no step-change after April 21st, but we'll keep looking. We're fortunate that Smartphone users are in the minority (around 11% currently) since we're a business-to-business site, but this could look very different if you're running a consumer-facing site - Smartphone visits could be well over 50% which is why this check is so important.


