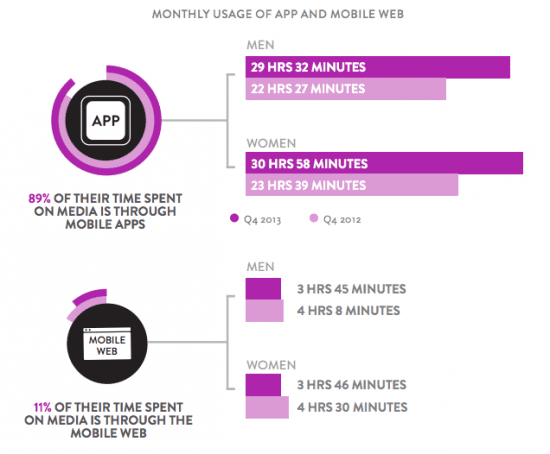
89% of consumer media time in mobile apps, 11% in mobile web according to latest statistics by Nielsen
Interested in finding out how content consumption has change across media? Whether it's video, apps, text, across linear, digital or mobile? Or how many hours are spent on apps and across which device?
Nielsen's research provides insights into US consumers changing media use which can help prompt changes in media investment. See our statistics page for sources for consumer media consumption insight elsewhere, including Ofcom and ONS in the UK and comScore.
Nielsen have combined the survey this quarter to look at the integration of mobile and video usage from their mobile insights survey along with metered data through Electronic Mobile Measurement.
According to Dounia Turrill, SVP Insights, 'as we create the tapestry of media consumption with its impact and opportunnity for Advertisers, it strikes me that we are in an era of tremendous growth and the quality of information is more important than ever.'
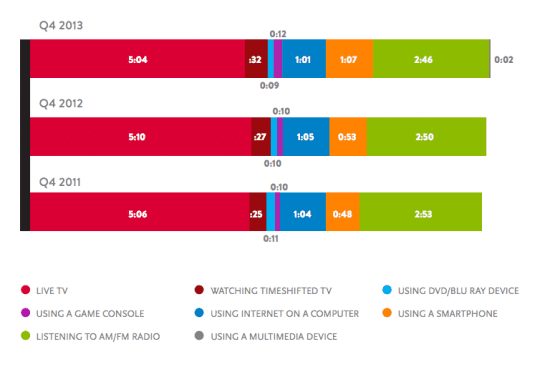
This gives a rare glimpse of cross-device media usage. Live TV still dominates despite timeshifting being available for quite some time now. Smartphone media has gradually increased compared to desktop Internet use and is greater in the most recent quarter.
Average consumer media use 2014 - time spent per adult 18+ per day

Importance of mobile apps for media time
As expected, there is heavy usage of accessing apps on mobile devices, due to the accessibility of apps across social networks and news apps - as information is consumed more on mobile as can be seen by the decline in print for media.

The 89/11% split of media time spent by consumers on mobile apps against mobile web is shocking although our mobile statistics research page we show other data showing a similar 80/20 split.
You can Download Nielsen's March 2014 Cross Platform report for more insight.


