An introduction to the 6 new Social Reports in Google Analytics
In my previous post I wrote about the increasing importance of social media with SEO. In this follow-up I'll show how Google Analytics can be used to assess how effective you are in generating social signals through an engaged audience.
Using Google Analytics social reports to measure impact
Google Analytics introduced a new Social report suite in March 2012. This makes it much easier to evaluate the contribution of traffic from social media domains and sharing of content from your site on social networks.
When it was first announced it was known as "Social Analytics" (see Dave Chaffey's introduction to 10 features) and had its own menu option. Now the Social report is integrated in the Traffic Sources report, available by selecting "Social". There are 6 reports available which I will explain. If you haven't used them, I recommend it, it certainly makes understanding the contribution of social media easier than previously when you needed to set up Advanced segments to show the contribution of social media.
Using campaign tracking for social media
Before I look at each of the reports, a reminder that, by default, Google will only be able to show you direct visits from the social networks such as clicking on a link to a site within the network. This means that if someone visits via a desktop or mobile app such as Hootsuite or Tweetdeck this contribution won't be recorded - it will be a direct visit. However, if you use campaign-tracking codes, you can more accurately evaluate the impact of individual links. Tim Leighton Boyce discussed these inaccuracies in this post How to track visits from social media. The other advantage is that you can segment different types of link to evaluate what type of content works best on each social network.
Google Analytics provides a free URL builder you can use to add these campaign-tracking codes. Or if you speak to Dan Barker, Smart Insights Analytics expert, he can whip up a wonderful automated online tool using Google Docs and the Bit.ly API.
Now, onto the 6 new social reports.
1. Overview
This gives a snapshot of the top-level data for your website. Use it to keep an eye on the contribution of social traffic to:
- Visits
- Social referrals
- Conversions
- Assisted conversions
- Social networks sending traffic
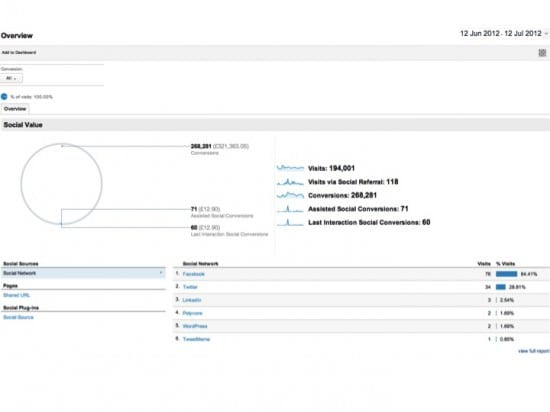
You can also create a Social Media Dashboard in GA, which can then be exported to distribute to other people in the business.
2. Social sources
Use this report to identify traffic trends for social media and compare social traffic to your overall site traffic.
You can:
- Use the table below the graph to look at which social networks are sending the most traffic.
- Click on each social network to see which pages on your website were shared on these networks + how many visits the pages received.
- By clicking on Activity Stream, you can see who is contributing to social sharing and the source content where your URL was found.
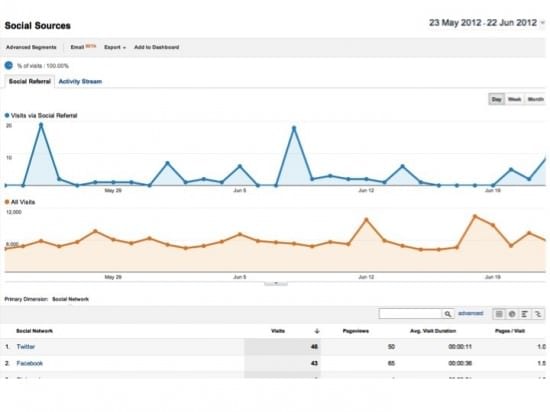
3. Pages
This report shows you which URLs are generating social activity. Click on each link to find out which social networks generated the visits. This is a good way to learn what content is most popular on each network.
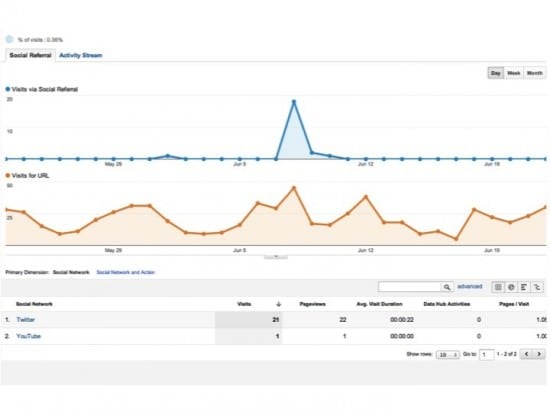
4. Conversions
This shows the number of conversions or goal completions made by visitors from social media networks. You first need to set up goals to enable this report.
You can filter the report to show conversion for individual goals or specific goal sets. Click on the button under “Conversion” at the top to select which goals to display data for.
If you have set goal values, the conversion value will also be displayed, helping you to assess which social networks are adding the most direct value.
NB. If you click on “Assisted vs. Last Interaction Analysis” you can then drill down into which social networks are contributing to conversions where the social visit is not the last click. This can help with your attribution analysis.
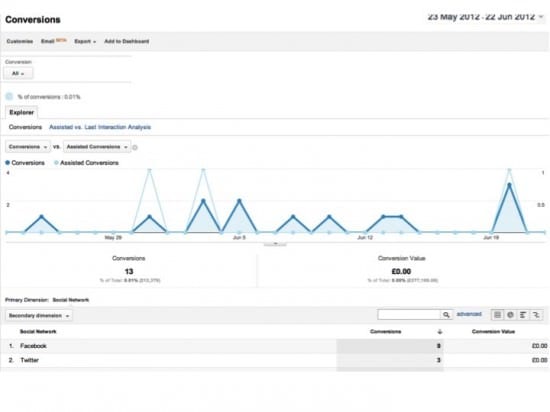
5. Social plugins
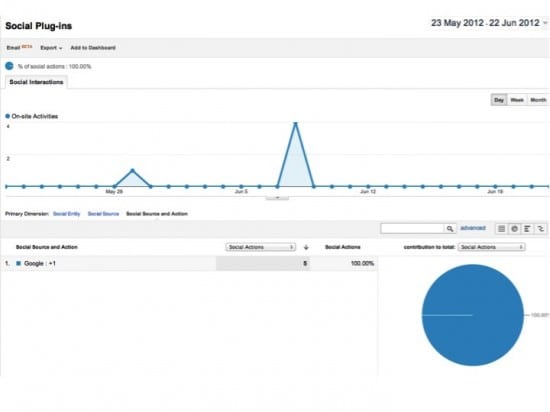
This section shows you how many times visitors have used the social bookmarking buttons on your website, as well as which pages are the most shared. This data helps you understand what type of content visitors are most likely to share socially.
By default, GA will only show data for the Google +1 button. To enable buttons like Facebook and Twitter, you need to add additional tracking code to your website. Turn to the GA Help Center for more info on social tracking.
6. Social visitors flow
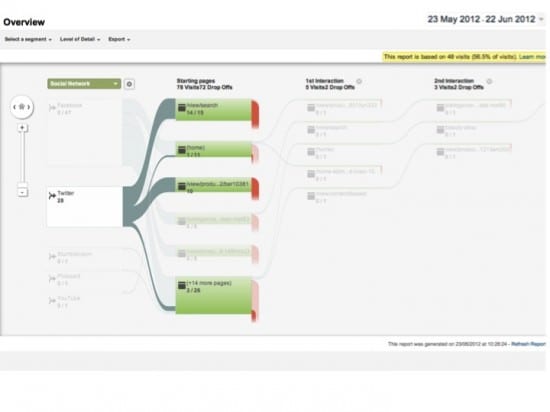
This gives you a neat visualization of how people from social networks flow through your website. This helps you identify common paths and exit points, giving you more insight into what social visitors are trying to achieve when they land on the site.
A few pointers:
- Highlight traffic flows from individual social networks to see how each audience behaves
- Highlight flows through specific landing pages to see how your content strategy is working for social traffic
- Identify exit points and ask yourself whether this is a relevant place for people to exit, or whether the page isn’t performing well.
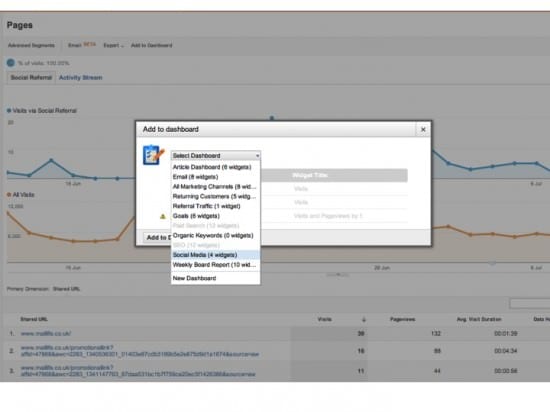
You’ll see on some of the reports a link for “Export” and “Add to dashboard”. These are really useful as they allow you to download the data to use outside of GA and add specific tables/graphs/charts to Dashboards you have already created.
Recommended further reading: KISSmetrics Ultimate Guide to the New Google Analytics Social Reports.


