E-commerce conversion rate and lead generation landing page stats for desktop and mobile devices for benchmarking averages across different industries
As you will know, conversion rates are often used as a KPI to review the effectiveness of e-commerce sites. Naturally, all site managers and owners want to know the benchmarks - "how do our conversion rates compare?". As consumer and business confidence falls, it's more important than ever to audit and optimize your marketing success metrics.
In this post, I have compiled different free industry sources focusing on retail e-commerce conversion. At the end of this article, we also feature an analysis of landing page lead generation conversion rates by industry sector towards the end of the post. We keep this compilation updated as new conversion data is published in 2024.
E-commerce conversion funnel
This funnel-based view of the conversion process is a useful starting point since as well as the typical average basket and sales conversion rates, it also shows the conversion rates to product page views which aren't published so often:
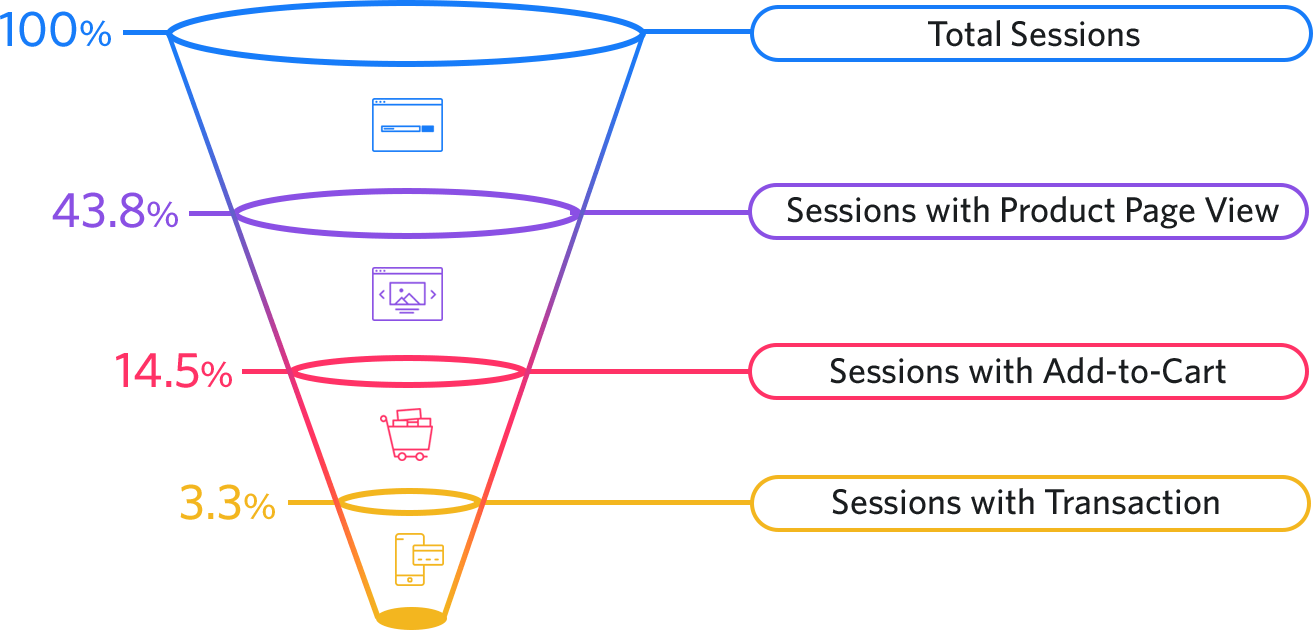
As would be expected, the number of sessions with product page views is much higher than the other micro-conversions, approaching 50 percent. This provides a useful benchmark and prompts retailers that it's useful to assess conversion to product page views when making site design improvements.
Note: This visual was originally created by Sales IQ several years ago, but we have retained it since it gives a clear visualisation of the challenges of conversion rate optimization. Read on to find out the latest conversion rates for B2C E-commerce and conversion rates in different sectors.
Digital marketing plan structured to increase e-commerce conversions
Structure your marketing plan around a funnel proven to boost performance. Join Smart Insights as a Free Member for instant access to our free digital marketing plan template to hone your skills and drive the results you need.
Free digital marketing plan template
Our popular marketing planning template is structured across the Smart Insights RACE Framework. Join Smart Insights as a Free Member to download our digital marketing plan template today
Access the Free digital marketing plan template
Retail E-commerce conversion rates by device and industry sector
In 2025, the two best sources for comparing your retail conversion rates are two e-commerce and personalization platforms, Dynamic Yield and IRP. Which is most useful will depend on your sector and size.
Dynamic Yield
Dynamic Yield is owned by Mastercard and provides conversion rates for medium to large brands aggregated across 200M+ monthly unique users from 400+ brands, collected over 300M+ total sessions. Their largest customers include multichannel retailers like Bertha, Decathlon, Ocado, McDonalds and Sephora, so conversion rates tend to be higher since these are trusted brands, however, shoppers may be browsing so they can buy offline.
View eCommerce statistics and KPI benchmarks
Here is the summary of engagement rates
| Sector | Mobile | Desktop | Overall |
| Device usage | 75.0% | 25.0% | N/A |
| Conversion rate | 2.8% | 3.2% | 2.9% |
| Add-to-cart rate | 6.4% | 6.2% | 6.8% |
| Cart abandonment rate | 79.0% | 68.1% | 76.2% |
Analysis of 2024 conversion rate statistics (Dynamic Yield)
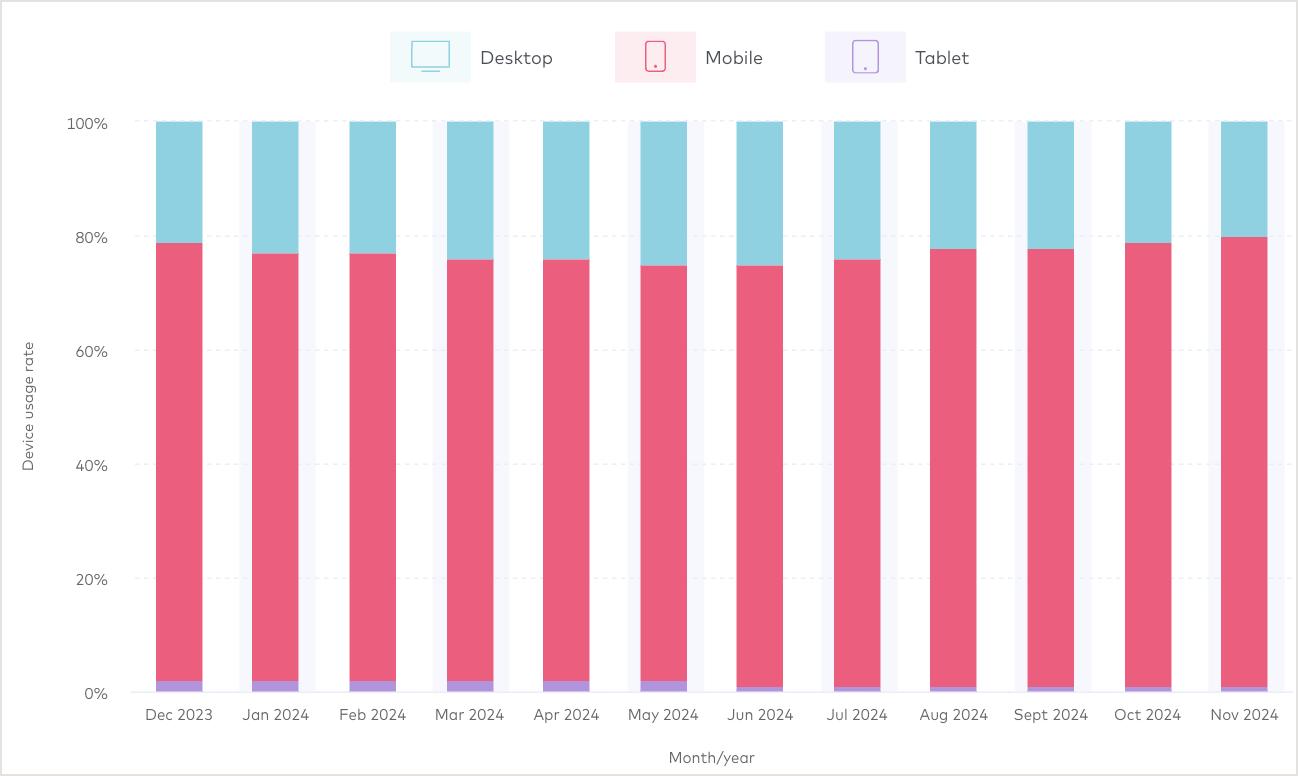
- Mobile usage dominates retails usage (approximately 70% to 30%) with tablet negligible (2%) so not shown.
- Conversion rates tend to be significantly higher on desktop (1.7 X) compared to smartphone. This is because those with the choice prefer to buy on desktop for usability and those on mobile may be browsing during traditional shopping. When we started these compilations 10+ years ago the ratio was higher (> 2X).
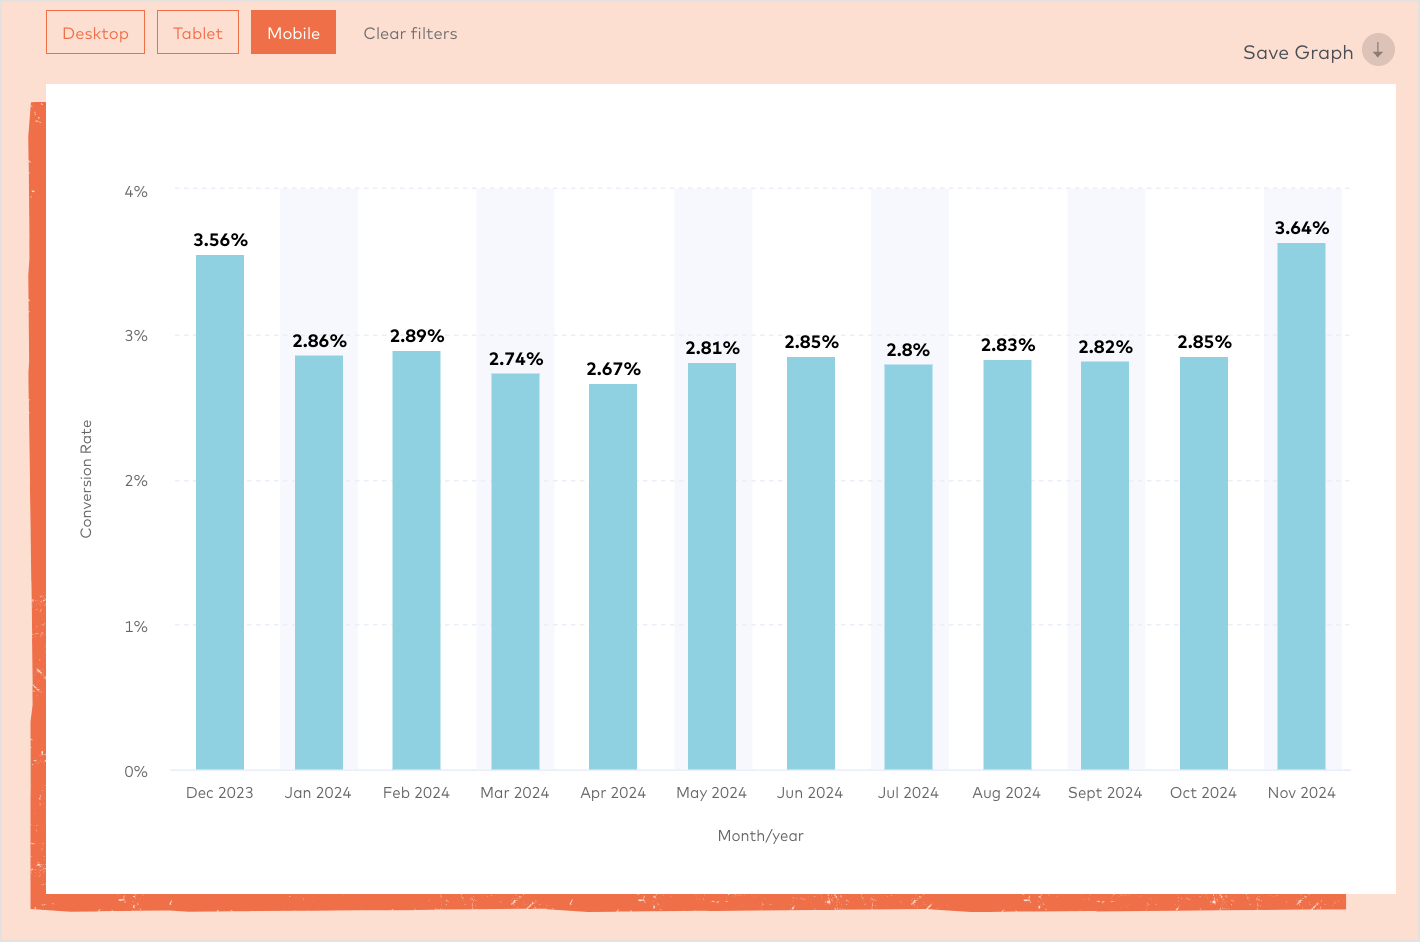
- Conversion rates tend to be highest in November due to Black Friday promotions, so you have to compare for similar months to allow for seasonality or best average across the whole year.
- Given these patterns, modelling of sales based on conversion rates should consider both desktop and mobile conversion based on the proportion of visitors in a business.
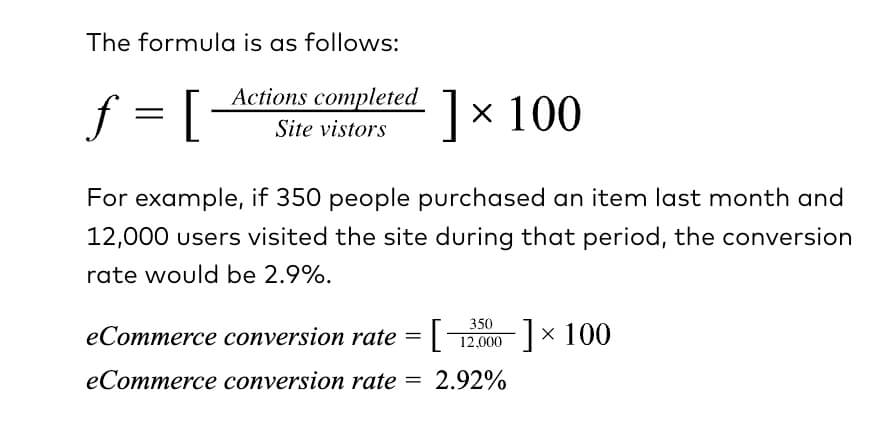
- Take care when reviewing these benchmarks since definitions of conversion rates may differ since sales may be be based on either number of people, transactions or sessions. For this data conversions are calculated based on actions completed people. i.e. number of sales completed by users over a fixed period of time (i.e. one month) divided by the number of users that visited the site during the same period. Multiply this number by 100 to calculate the conversion rate.
Device usage - Desktop vs Mobile
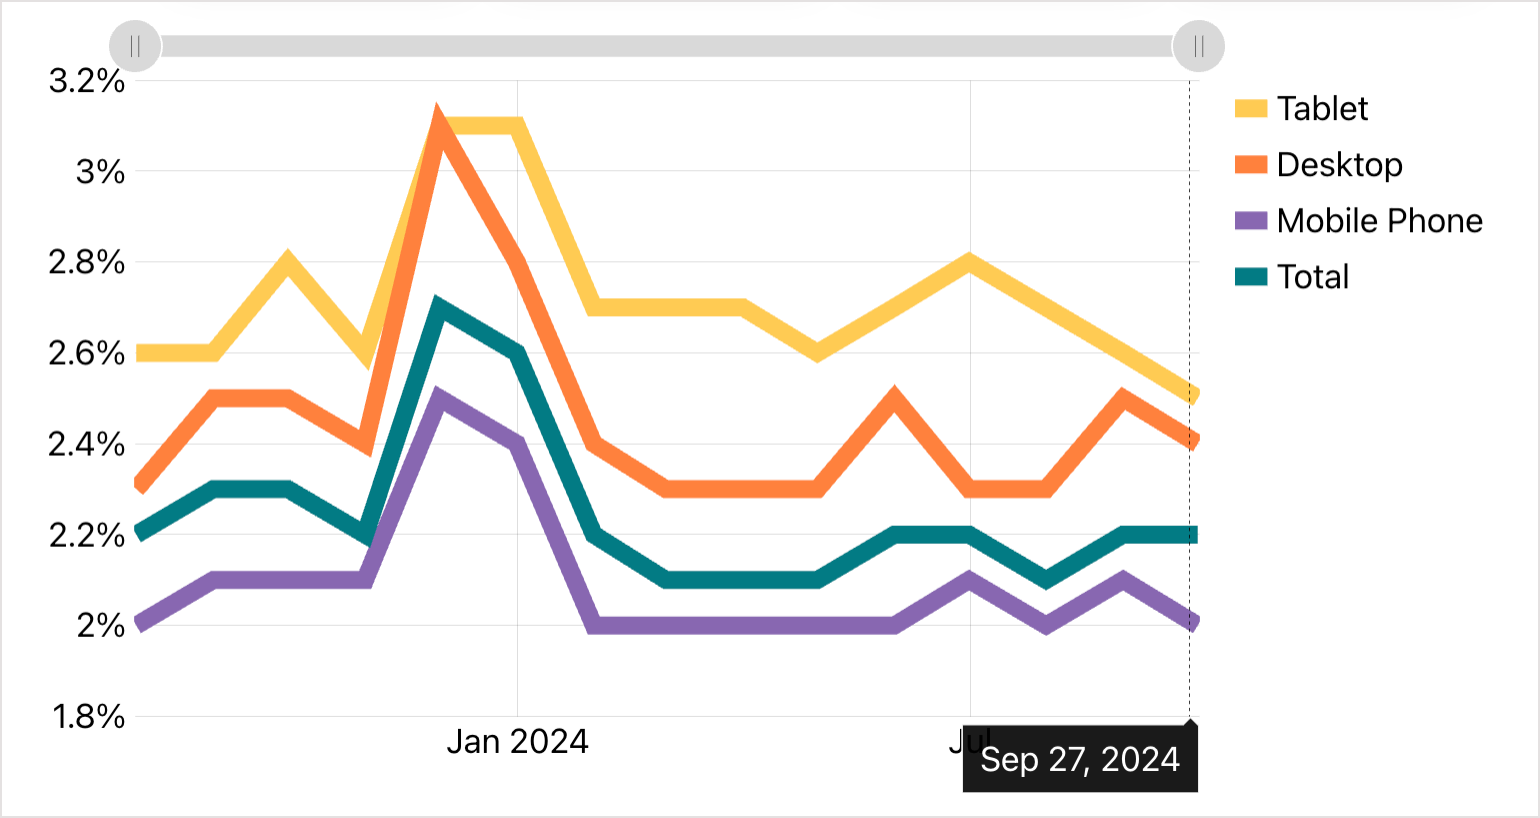
Retail conversion rates - Mobile
Note the higher conversion rates during November to December sales periods showing the importance of modelling different conversion rates in these periods when forecasting e-commerce sales.
Retail conversion rates - Desktop
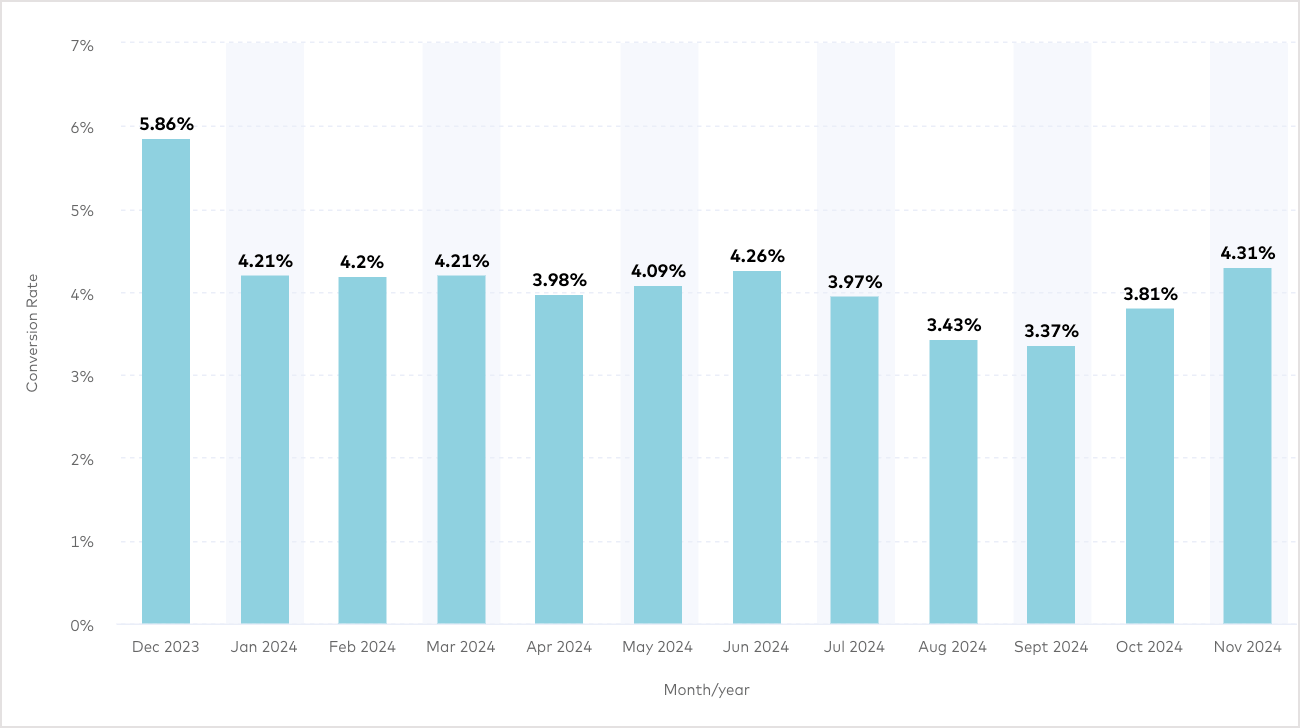
Add-to-cart conversion rates - Mobile
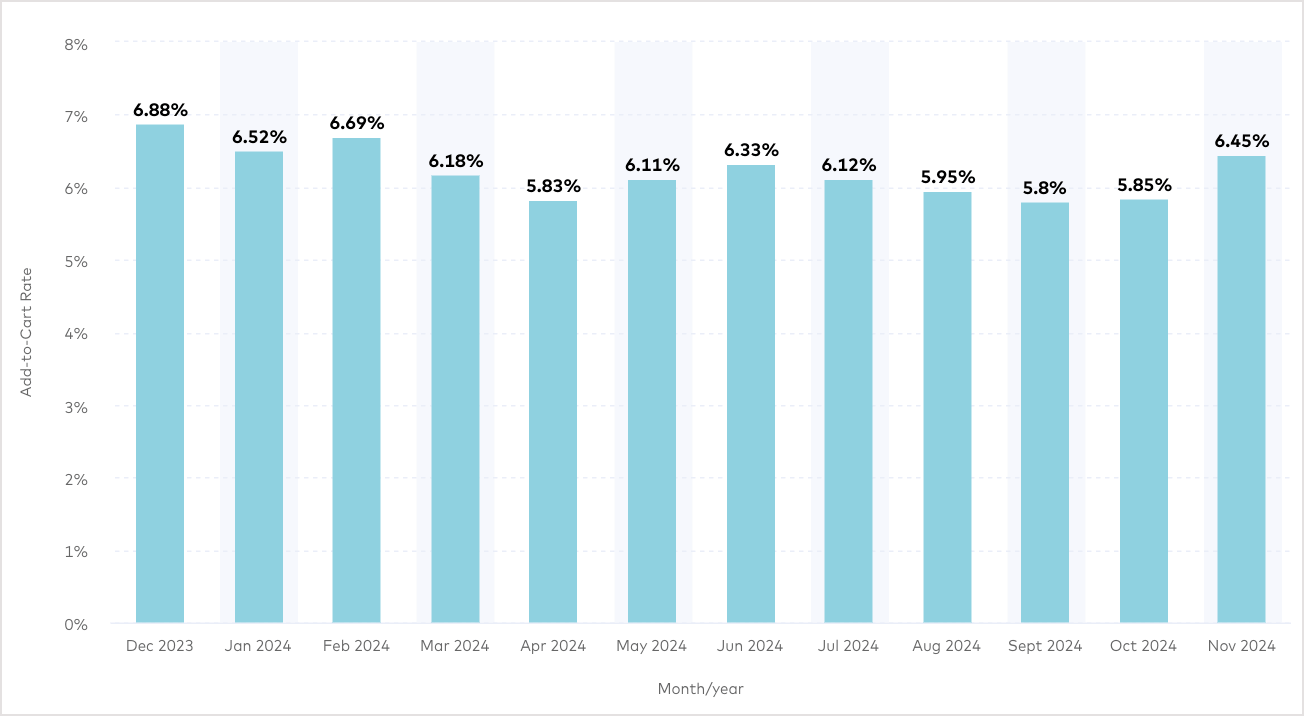
Add-to-cart conversion rates - Desktop
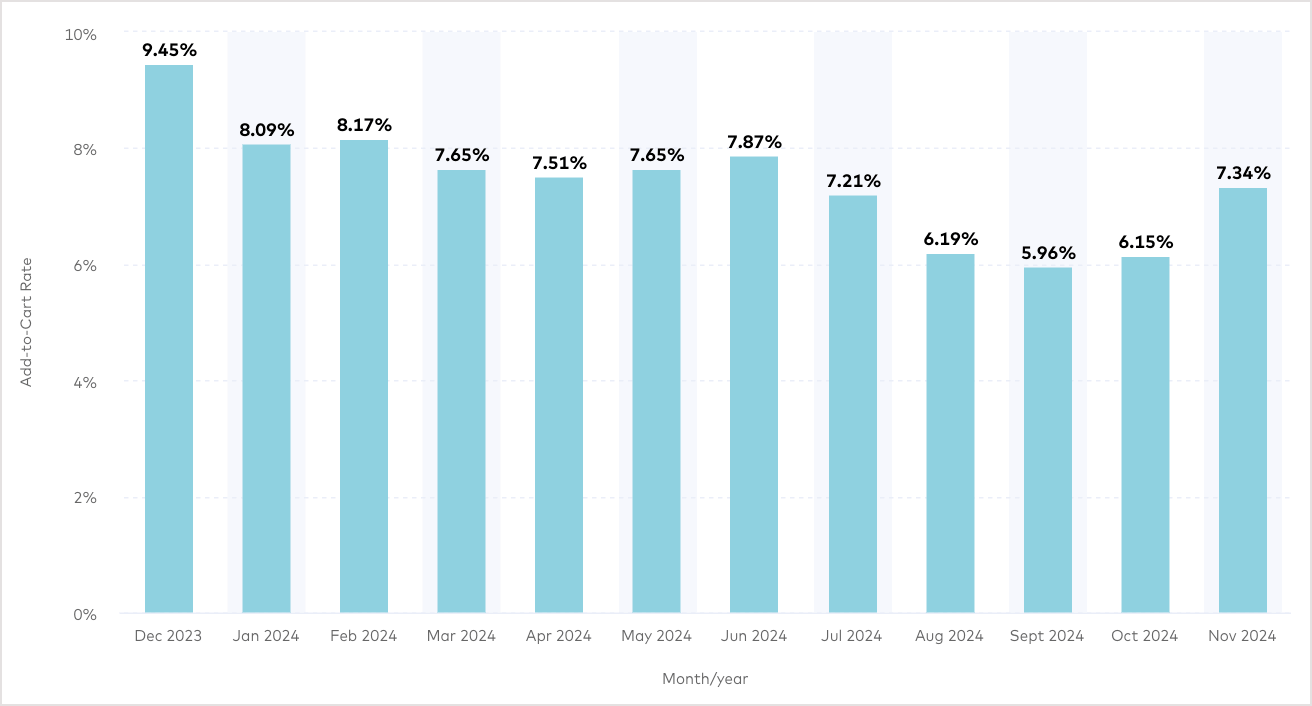
Industry sector conversions
If you work in a particular sector you can filter on this in the benchmarks. This is needed since there is considerable variation by sector - over the past twelve months, Food & Beverage has seen the highest conversion rates, at 4.9%, and Home & Furniture has seen the lowest, at 1.4%.
- Multi-brand retail
- Pet care
- Consumer goods
- Beauty
- Fashion, Accessories and Apparel (Shown)
- Food and Drink
- Homeware
- Luxury and Jewelry
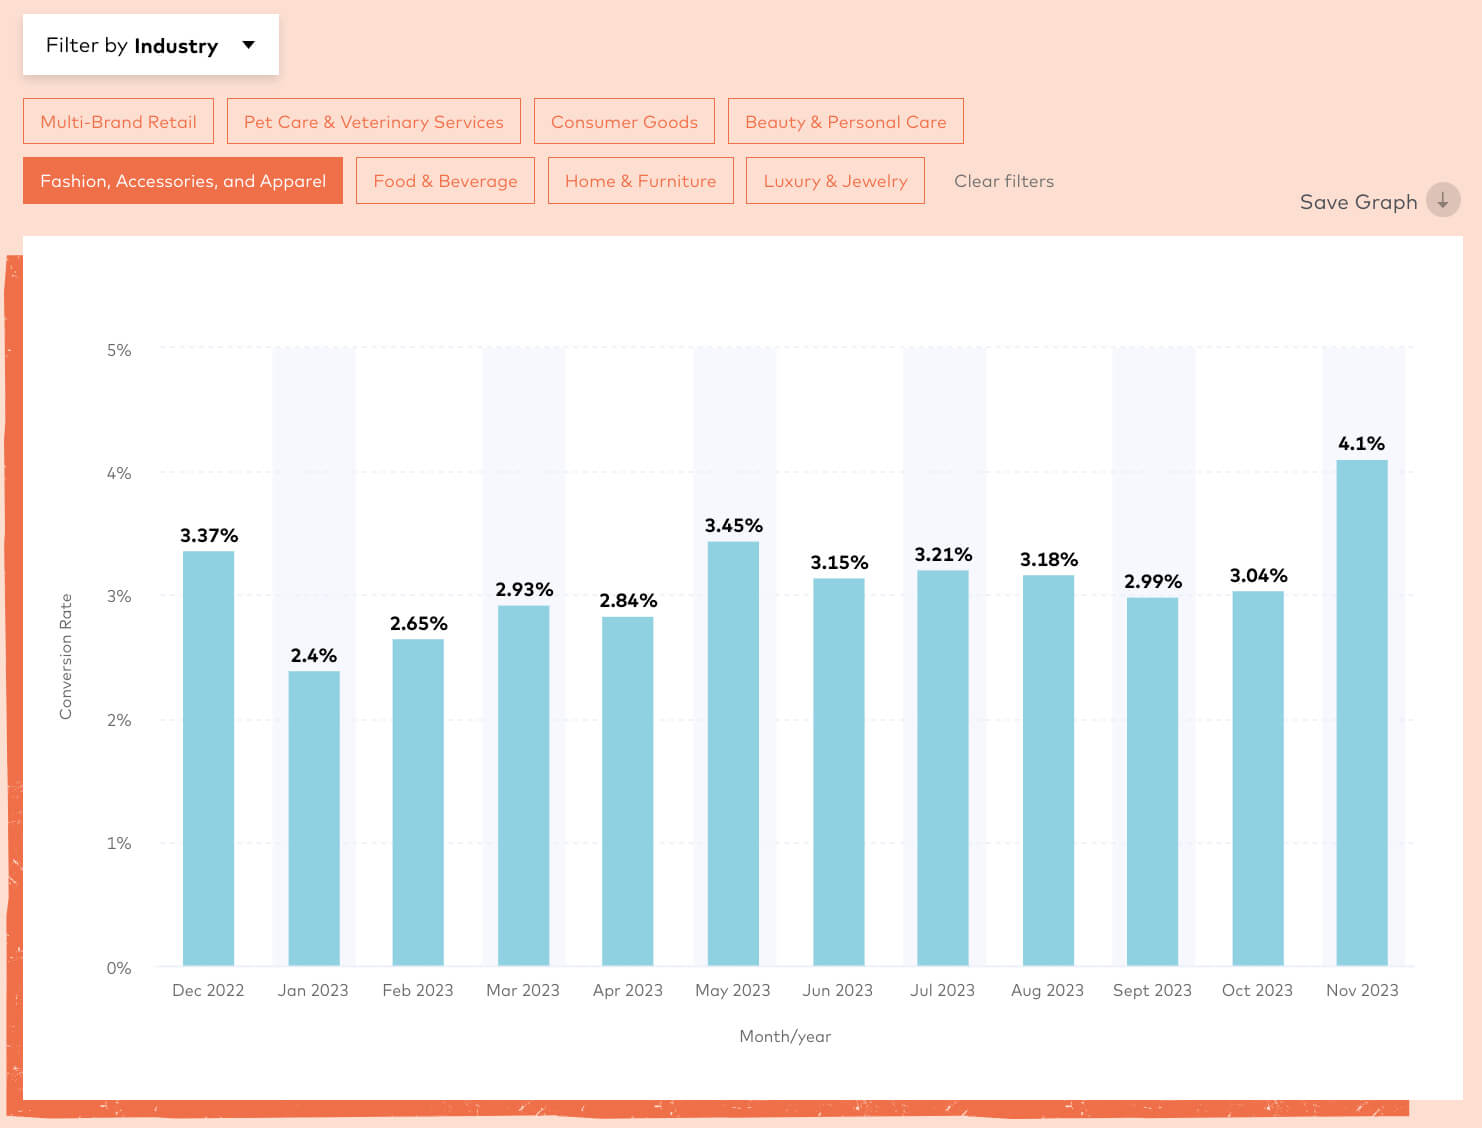
IRP
IRP are a smaller business than Dynamic Yield based in Northern Ireland with clients in that country and Ireland, they are recommended since they are representative of conversion rates for smaller ecommerce businesses and also present sector conversion rate date and for other Ecommerce KPIs including Average order value and CPA,
View Ecommerce Market Data and Ecommerce Benchmarks
Their data shows the challenge of online retail today with some basic figures you can use for benchmarking different parts of the conversion funnel.
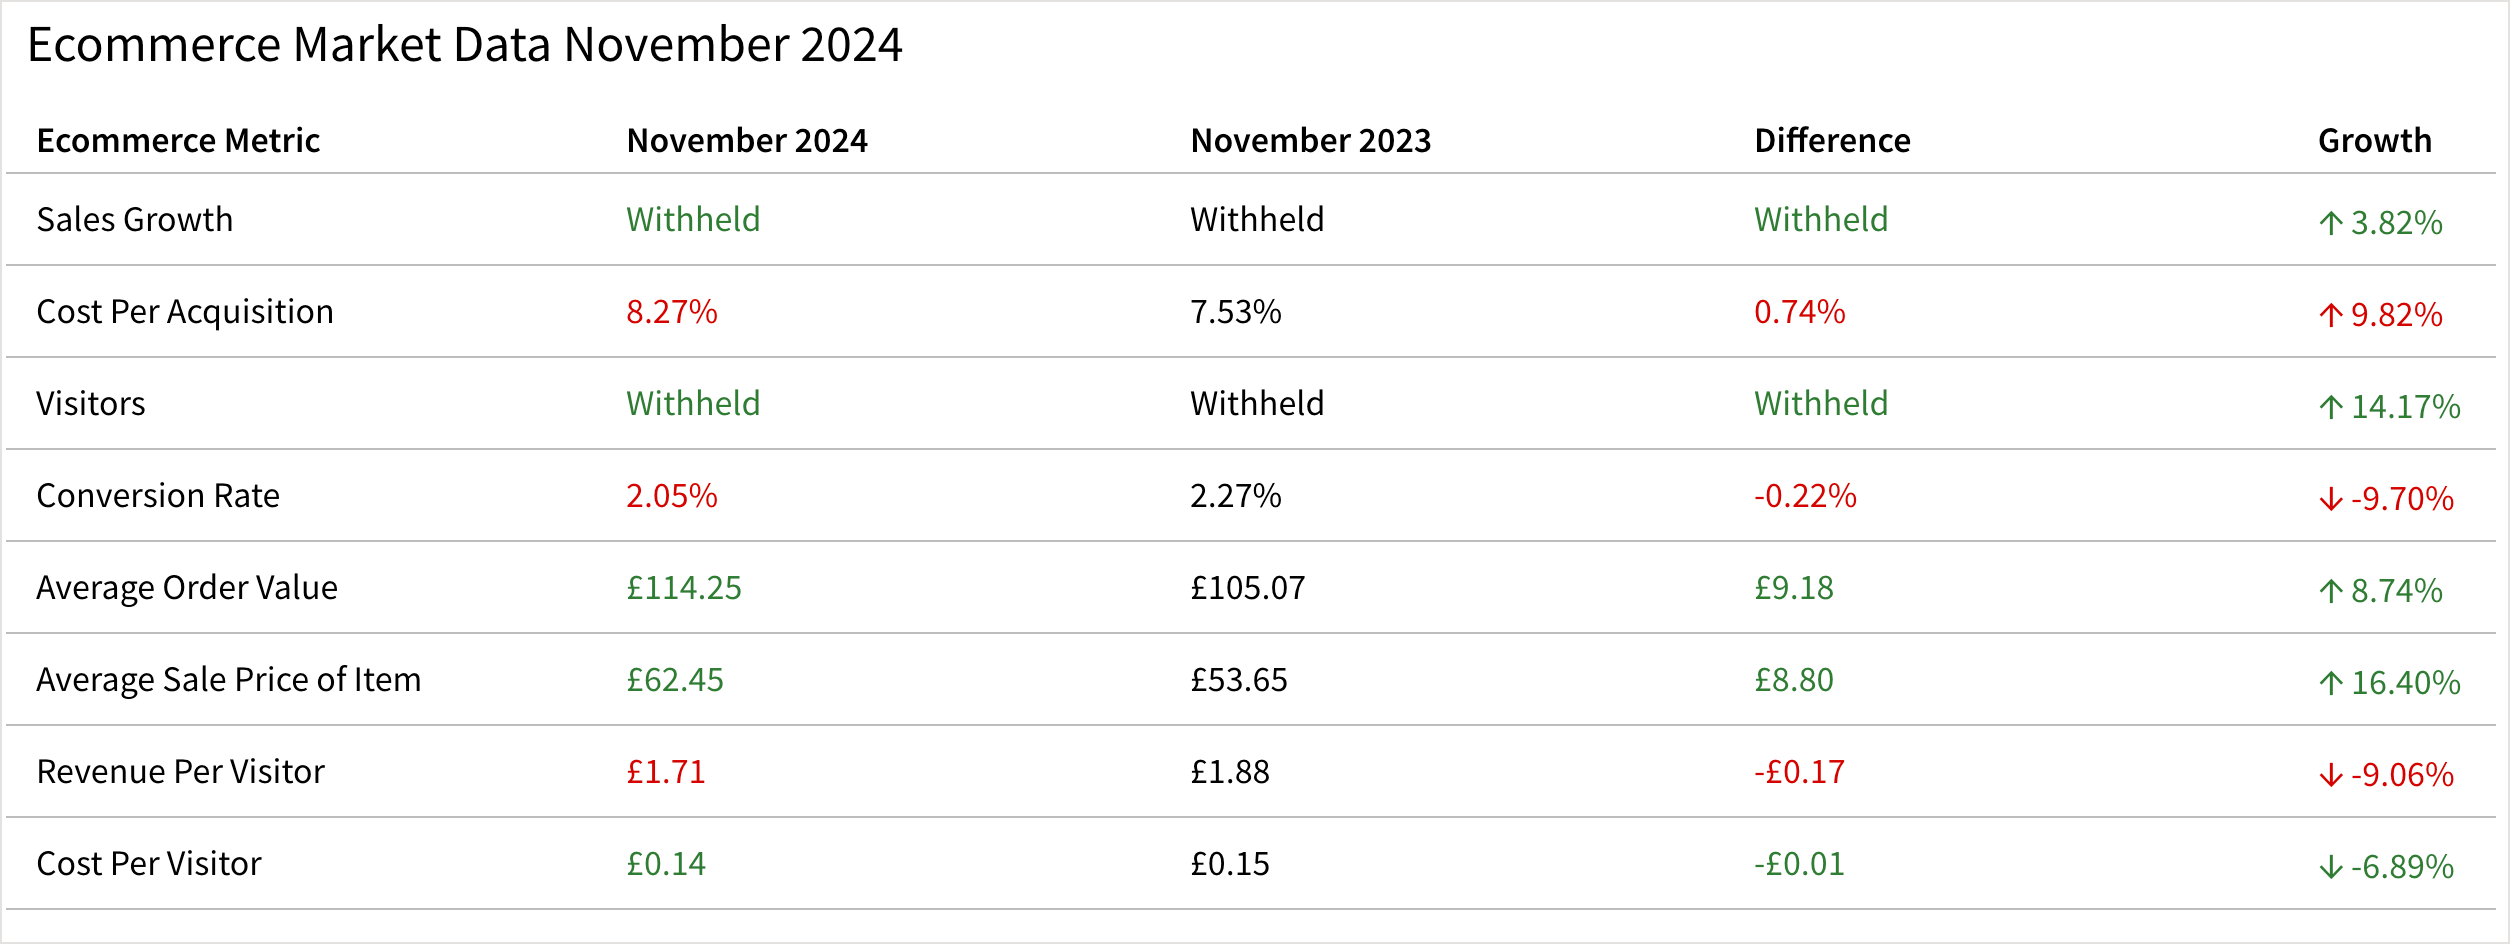
Further compilations of E-commerce rate with details on how to calculate conversion rates are provided here. These no longer present rates from their platforms:
Lead generation and landing page rates conversion benchmarks by industry
Many marketers set their KPIs based on industry benchmarks. For example, if you’re catering to a market with a lower overall conversion rate, a good conversion rate may still be lower than the average across all industries.
Unbounce's Conversion Benchmark Report compared B2B and B2C landing page conversion rates to lead across 16 industries - with 'catering & restaurants coming up top with an average conversion rate of 18.2%. Agencies and real estate represent the other end of the scale, converting only 8.8% on average.
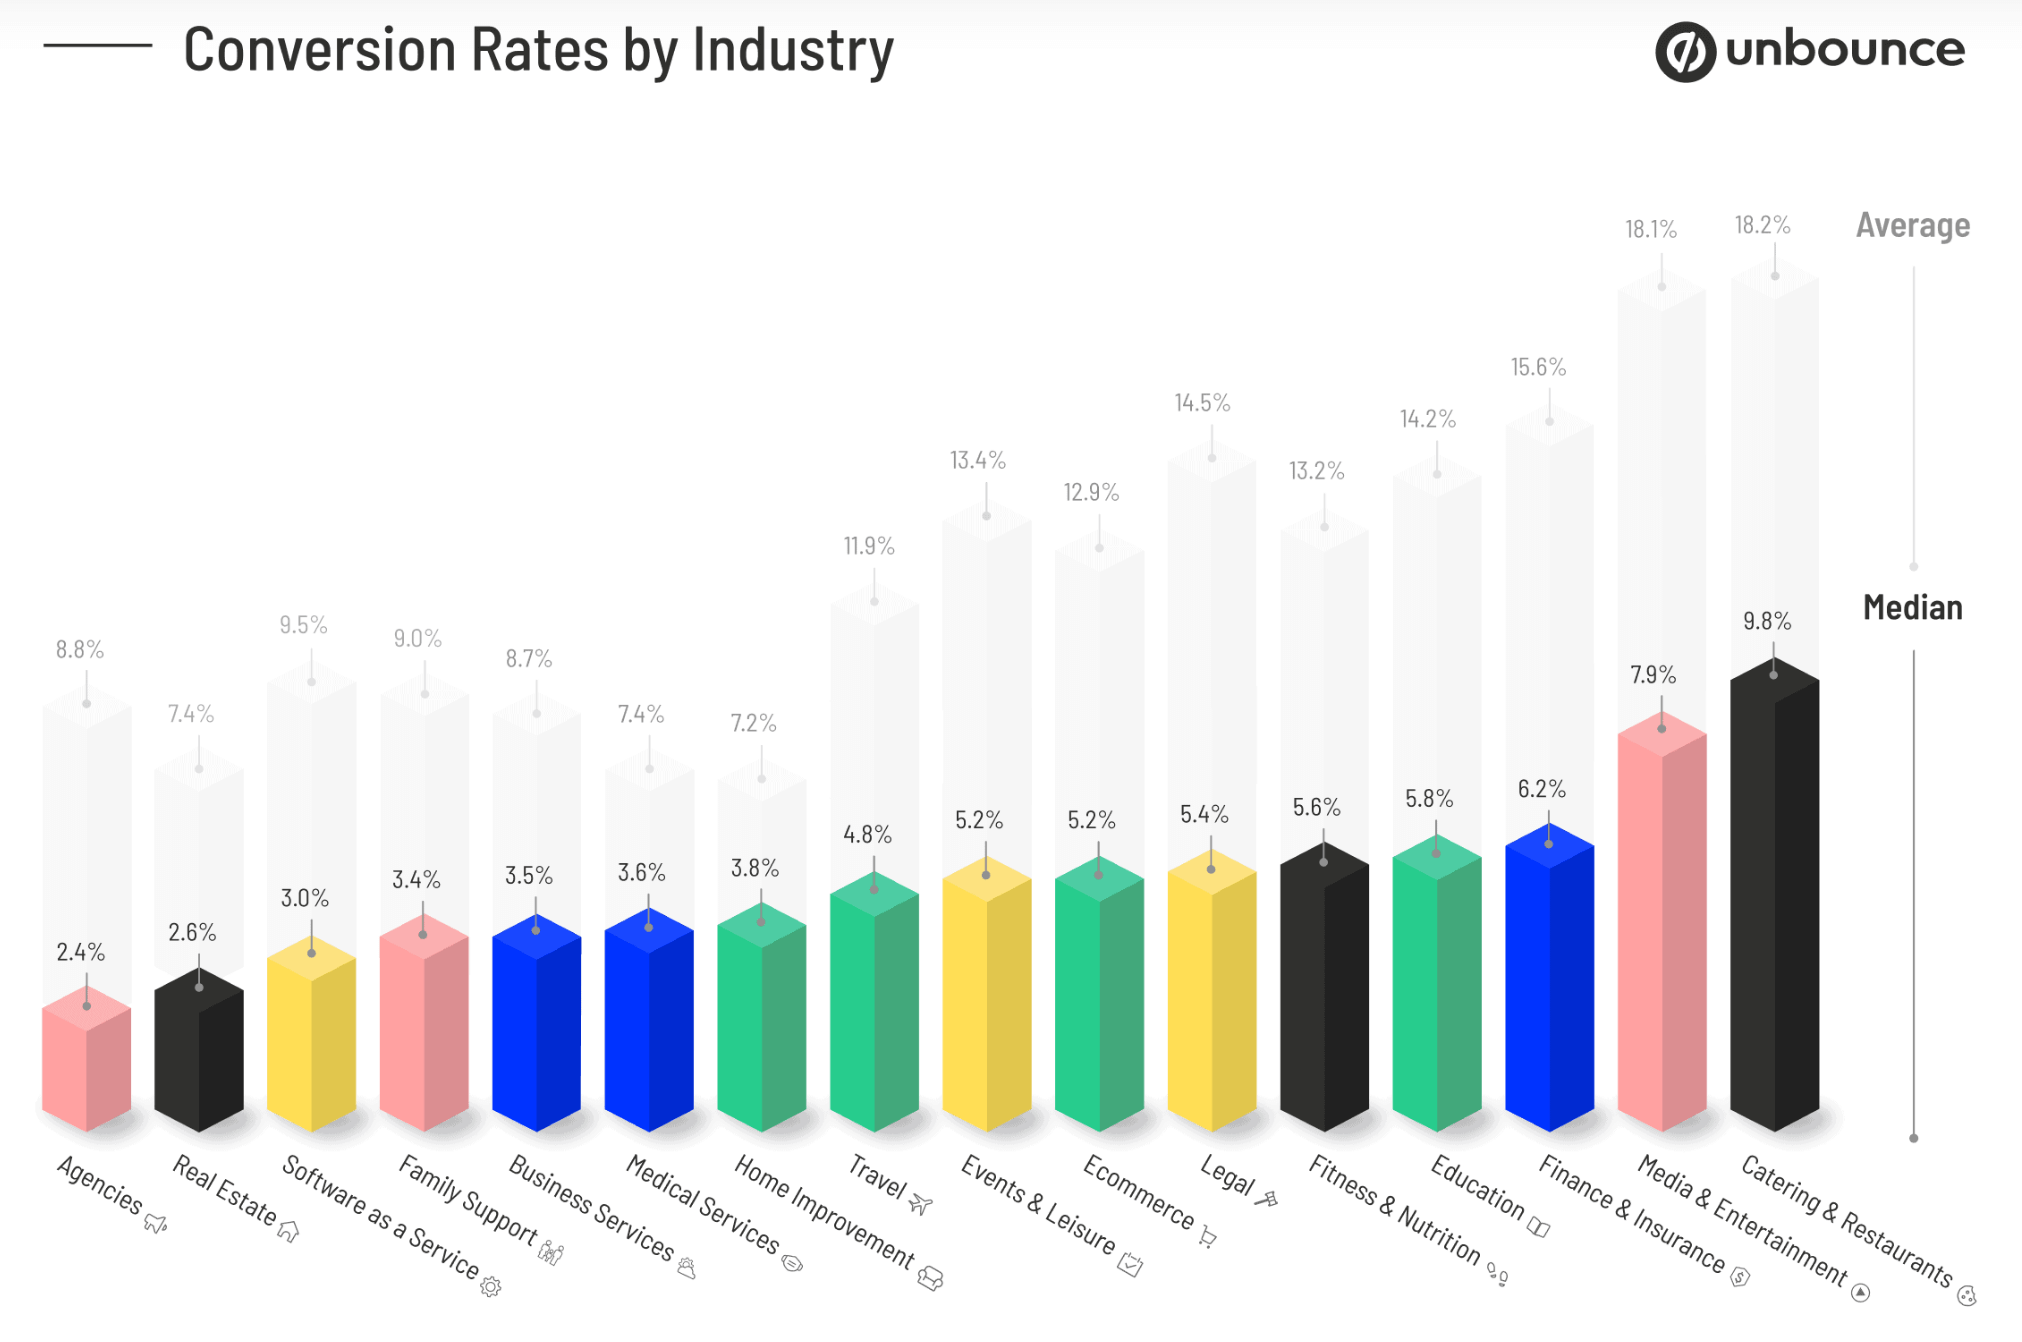
Note that this benchmark was published in 2021 and hasn't been updated, but is still available in early 2024 .
Landing page form completion conversion rate comparison
Another source to use for both B2C and B2B benchmarking lead generation efficiency which has unique insight breaking down the process by sector is provided by the Zuko form performance benchmarks (last updated 2022).
Form types include purchase, inquiry, and registration data. Most forms tracked are transactional forms of various kinds, but you can see the full breakdown below.
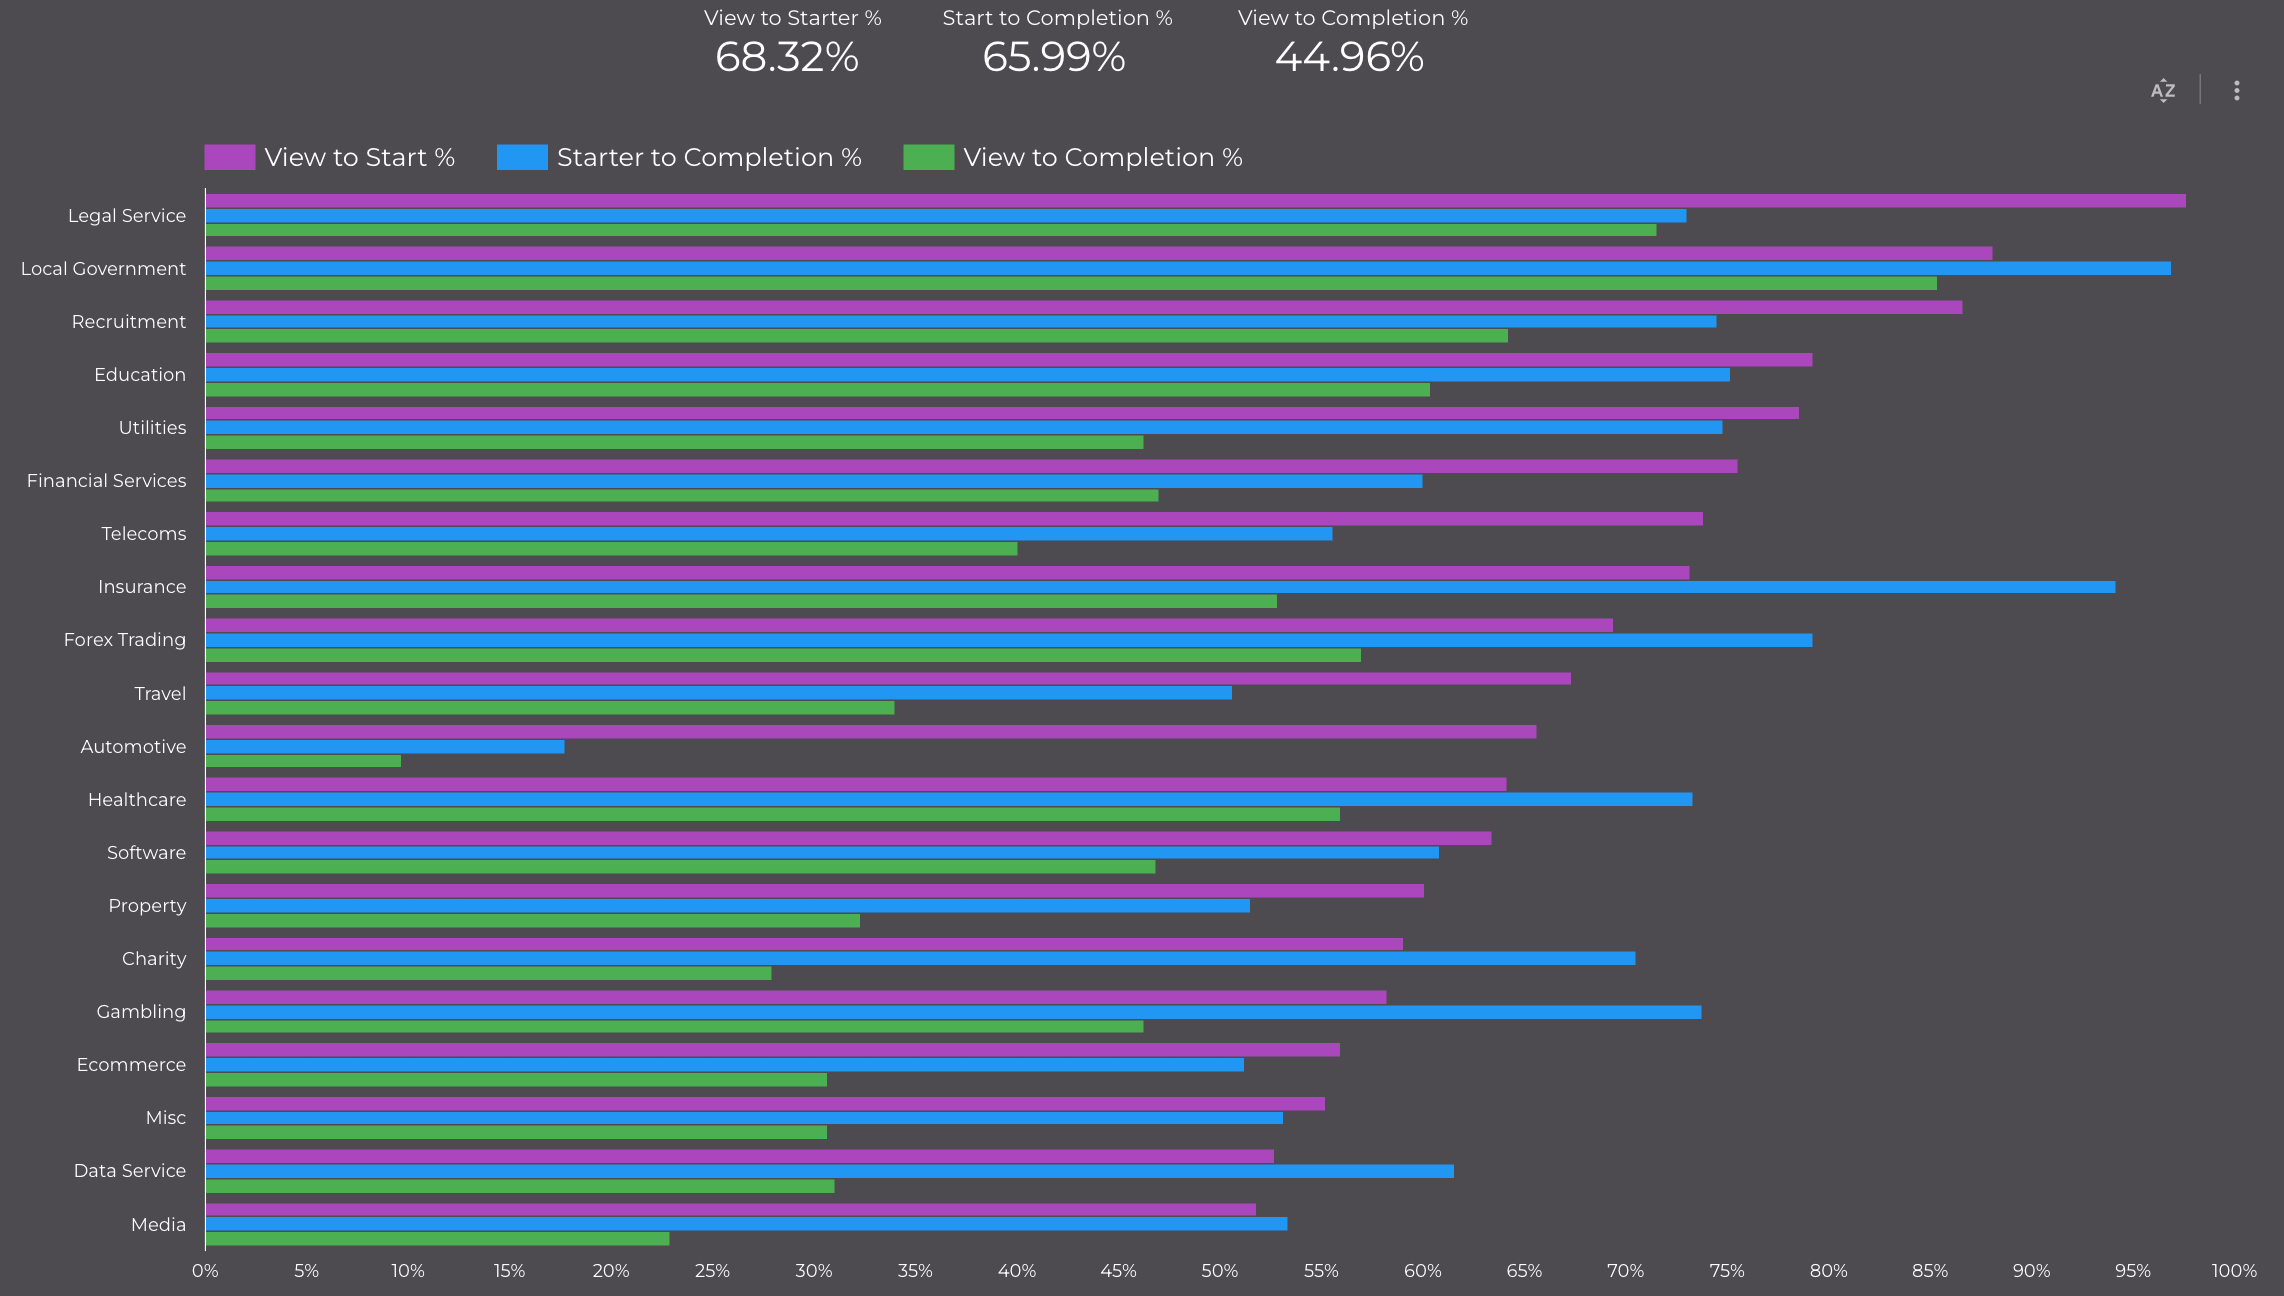
This shows that typically only one-third of people start entering data into the form, showing the value in AB testing to ensure you make the value of completing the form via the title, copy, imagery and follow-up clear. Overall, just under half typically complete each form.
Want to find out more? Keep up to date with the latest e-commerce stats and trends to reach and convert more customers on your digital platforms. We have tools and training to support a data-driven approach to improve your e-commerce conversion rates. Start now.
Omnichannel conversion rates
Compilations of published conversion rates often only consider online conversion to sale. Research by Google and Wolfgang Digital shines a light on ‘research-online purchase-in-store’.
"By uploading Point Of Sale information to Google, retailers can now match in-store purchasers with online ad clickers, gaining further visibility on the success of their campaigns."
The results speak for themselves: digital marketers saw an extra 168% in revenue in their in-store sales, on top of what was made online.

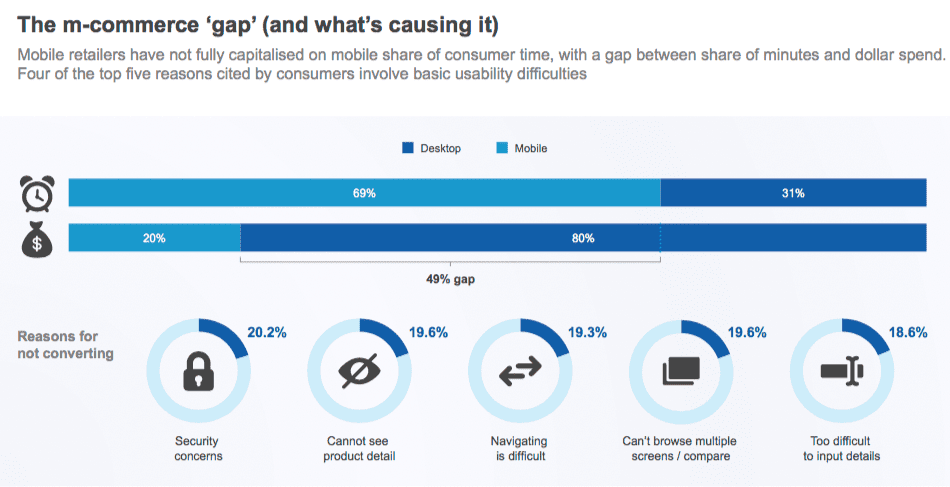
What are the reasons consumers are less likely to buy on smartphones?
The comScore Mobile Hierarchy report has some useful insight into this, which retailers can use to improve their service or messaging to reassure consumers.
Use our digital marketing plan template to streamline and prioritize your marketing activities across a simple marketing funnel of reach, act, convert, and engage. Find out more.
Free digital marketing plan template
Our popular marketing planning template is structured across the Smart Insights RACE Framework. Join Smart Insights as a Free Member to download our digital marketing plan template today
Access the Free digital marketing plan template
How are e-commerce conversion rates measured?
When benchmarking conversion, it's important to consider the denominator. Are you dividing the number of sales by the number of unique visitors or visitor sessions?
In Google Analytics, which can be considered the standard reference, sales transactions are divided by visits. E-commerce Conversion Rate is defined by Google as:
"The ratio of transactions to sessions, expressed as a percentage. For example, a ratio of one transaction to every ten sessions would be expressed as an Ecommerce Conversion Rate of 10%".
Before we get to the stats, a couple of caveats on benchmarking conversion rates:
When benchmarking conversion rate, we think it's important to explain to marketing managers that they should go beyond headline conversion rates to segment conversion by different types of visitor.
To see why, take a look at Dan Barker's excellent post explaining why conversion rate is a horrible measure to focus on...
Options for segmenting e-commerce conversion rates
As Dan Barker suggests in his advice we mentioned at the start of this post, conversion rate gets more useful as you break it down by different types of visitors with different intent and a different relationship with the retailer.
Different conversion rates and average order values can then be segmented for different audiences to understand and work to improve the quality of traffic or strength of propositions, for example:
- First time, repeat visitor or registered customer conversion
- Referring channel conversion, e.g. paid or natural search, social media, affiliates, display advertising
- Search type, e.g. paid or natural, brand, generic or long-tail
- Product category type - conversion rates are much higher for simple commodity products for example - flower purchase (double-digit percentage) compared with a higher cost product that will often be purchased in-store (for example beds or furniture which will often be less than one percent).
- Promotion type or seasonal sale - the IMRG data and Coremetrics data below shows that conversion rates can increase dramatically at these times.
Keep up to date with the latest digital marketing stats and trends to reach and convert more customers on your e-commerce website. Identify new opportunities to develop your digital strategy and win more customers with our dedicated guidance and support for retailers.


